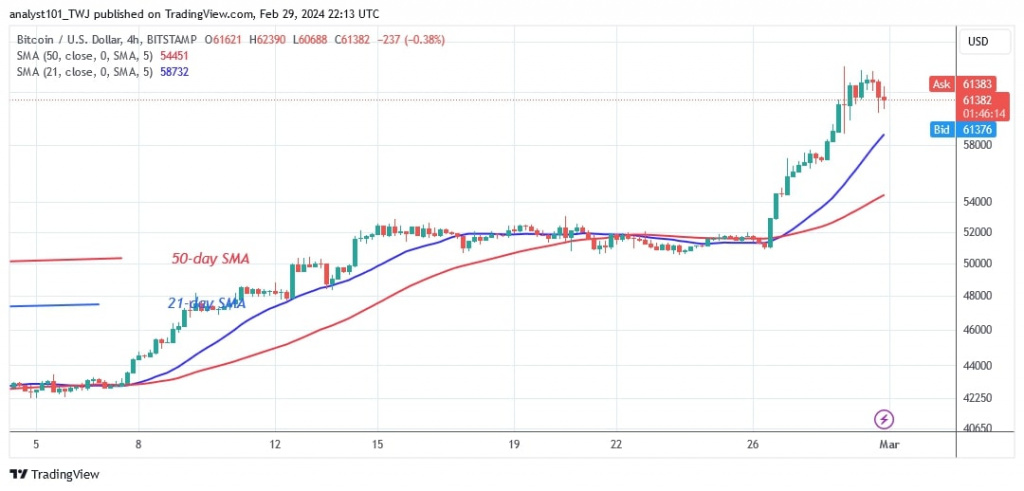
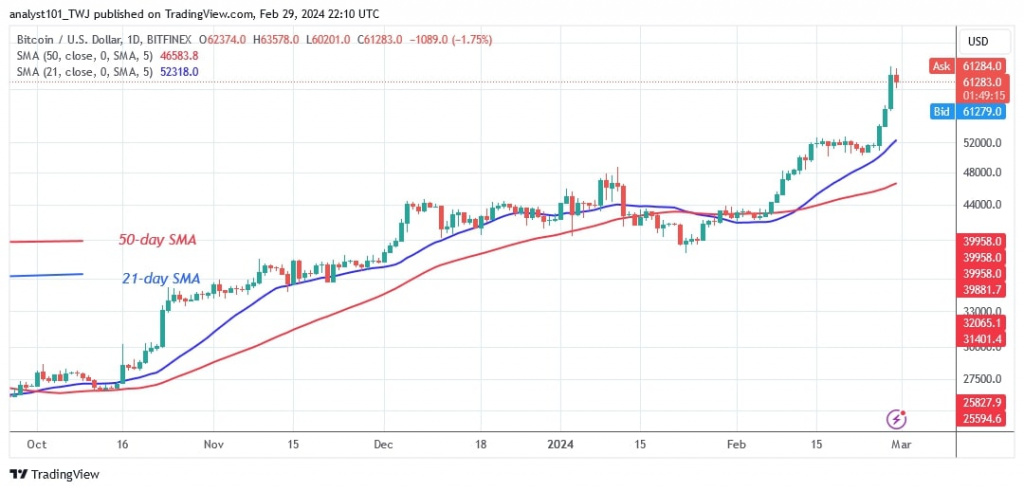
The price of Bitcoin (BTC) has risen and crossed the psychological threshold of $60,000. On March 1, 2024, BTC price faced corrections at $62,000
Long-term forecast for the Bitcoin price: bullish
The largest cryptocurrency reached a high of $63,905 on Wednesday, February 28, as Coinidol.com reported before. The cryptocurrency is currently experiencing a minor setback as it falls below the high of $52,500.
Bitcoin has formed another range since reaching its last high. The cryptocurrency is trading above the support level of $60,000 but below the high of $52,500. If the bulls break the $52,500 level to the upside, the market will reach a high of $67,600. On the downside, if the bears break the $60,000 support level, selling pressure will pick up again and Bitcoin will fall to a low of $52,000.
Bitcoin indicator readings
The 21-day SMA and 50-day SMA are still sloping north, indicating an uptrend. After the recent rally, the BTC price stabilised above the $50,000 support before rising above the 21-day SMA. However, should the bears break the 21-day SMA, the cryptocurrency would fall.
Technical indicators:
Key resistance levels – $55,000 and $60,000
Key support levels – $45,000 and $40,000
What is the next direction for BTC/USD?
Bitcoin is trading below its recent high after reaching resistance at $64,000. On the 4-hour chart, the market has fallen above the $61,000 support level. The price of the cryptocurrency will continue to rise if it stays above the moving average lines.

Disclaimer. This analysis and forecast are the personal opinions of the author and are not a recommendation to buy or sell cryptocurrency and should not be viewed as an endorsement by CoinIdol.com. Readers should do their research before investing in funds.


