The price of Binance (BNB) coin has dropped below the moving average lines. Rejection at the high price levels of $234 and $239 caused the decline. BNB price analysis by Coinidol.com.
Binance coin price long-term prediction: bearish
Binance price has dropped below the moving average lines. A rejection at the high price levels of $234 and $239 caused the decline. BNB is now trading between $223 and $234 per coin.
On the positive side, further price increases are unlikely due to the rejection at higher price levels. Nonetheless, the Binance coin is at risk of a decline if the bears break through the $223 support. The altcoin will fall further to the low of $203. At the time of writing, the altcoin has fallen to a low of $228.20.
BNB Indicator Reading
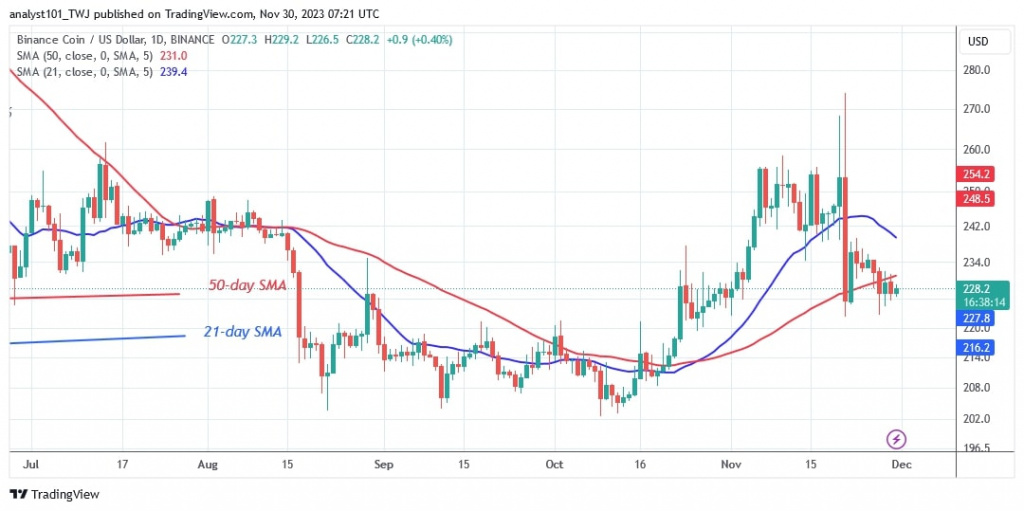
BNB’s price fell below the moving average lines for the second time on November 27. If the bulls do not buy dips, the downtrend will continue. The moving average lines are sloping downwards and indicate a downtrend.
Technical indicators:
Key resistance levels – $300, $350, $400
Key support levels – $200, $150, $100
What is the next direction for BNB/USD?
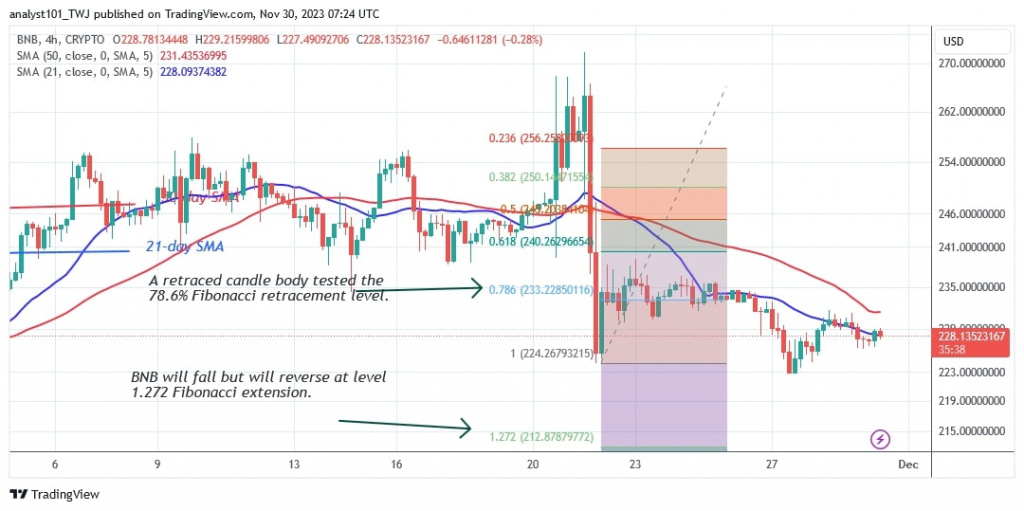
Resistance at $230 has limited the cryptocurrency’s upside. BNB is currently trading in a narrow range between $223 and $230. The price indicator predicted a likely dip in the cryptocurrency and a reversal at the high of $212.
Last week Coinidol.com reported that after reaching a high of $274 on November 21, Binance coin price fell below the moving average lines. The price has returned above the 50-day simple moving average but remains trapped between the moving average lines.

Disclaimer. This analysis and forecast are the personal opinions of the author and are not a recommendation to buy or sell cryptocurrency and should not be viewed as an endorsement by CoinIdol.com. Readers should do their research before investing in funds.


