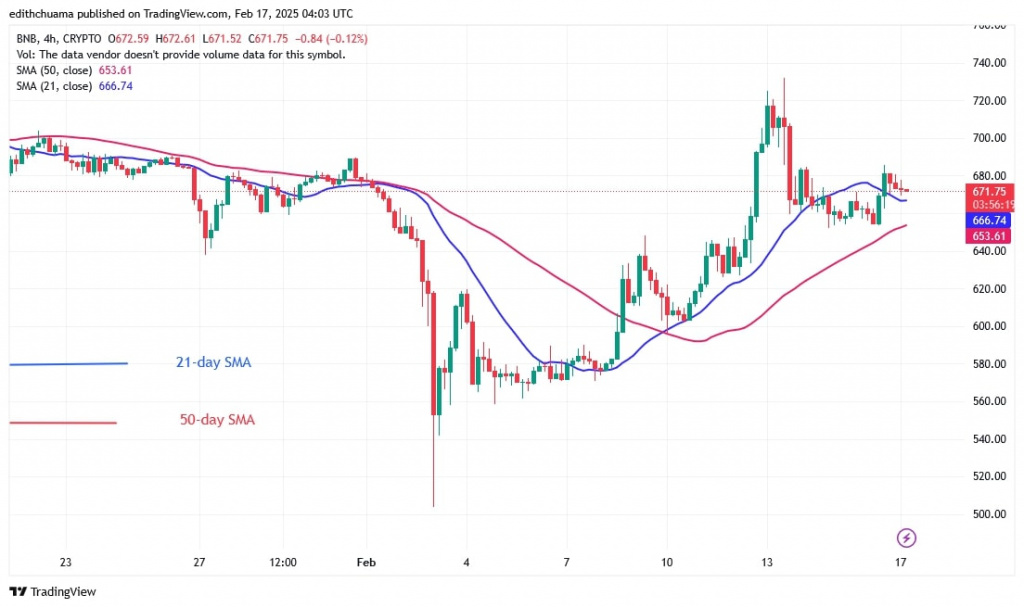
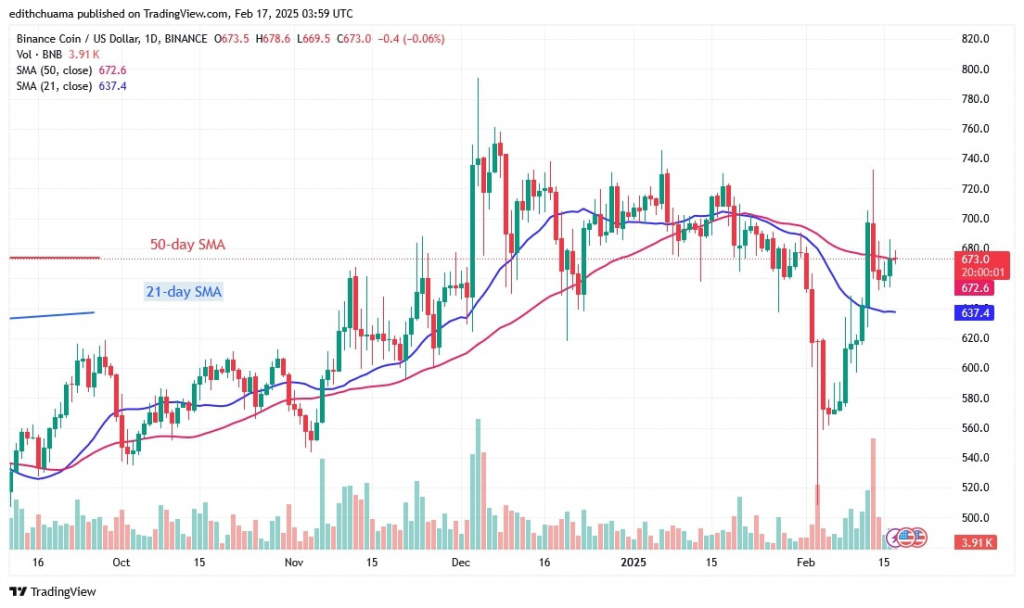
The price of Binance Chain Native Token (BNB) rose above the moving average lines on February 13 and reached a high of $732.50.
Long-term BNB price forecast: bearish
Buyers failed to sustain the bullish momentum above the moving averages. The uptrend was rejected and the price fell between the moving averages.
Currently, BNB is trading below the 50-day SMA but above the 21-day SMA. BNB will develop an uptrend if the moving average lines are broken.
On the upside, the altcoin will return to its previous high of $745 if buyers keep the price above the 50-day SMA. BNB will drop to as low as $560 if the bears break below the 21-day SMA support. At the time of writing, BNB is worth $671.
BNB price indicator reading
Doji candlesticks have emerged while the altcoin is trading marginally, indicating traders’ hesitation about the market direction. Since February 13, the altcoin has been trapped between the moving average lines. The price of BNB has fallen between these lines after a false breakout.
Technical indicators:
Key Resistance Levels – $600, $650, $700
Key Support Levels – $400, $350, $300

What’s next for BNB/USD price?
After the price drop on February 13, BNB is currently moving sideways on the 4-hour chart. The price range of $ 640 to $ 680 has been the limit of the upward movement in recent days. The doji candlesticks have slowed the price movement due to the current barriers.

Disclaimer. This analysis and forecast are the personal opinions of the author. They are not a recommendation to buy or sell cryptocurrency and should not be viewed as an endorsement by Coin Idol. Readers should do their research before investing in funds.


