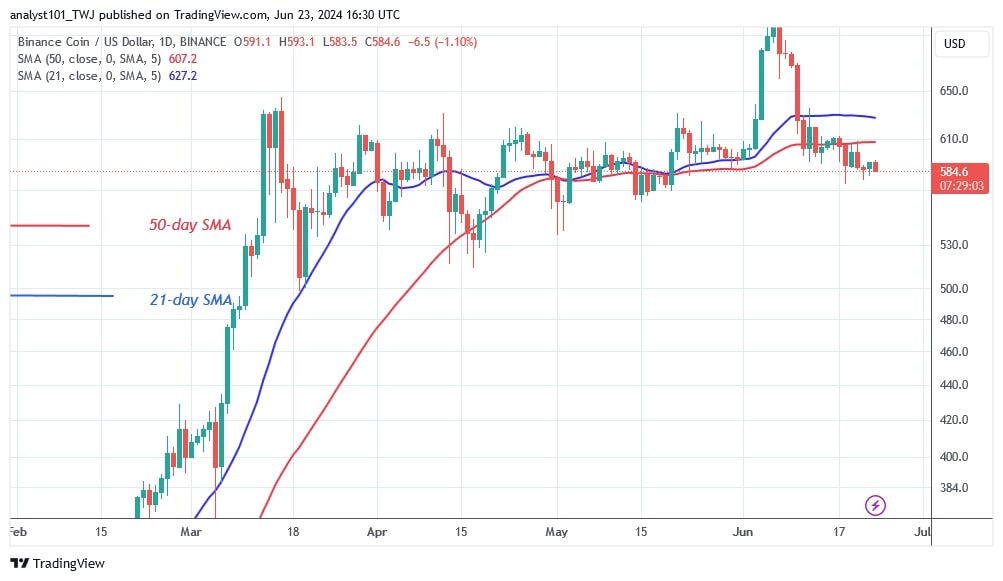
Binance Coin (BNB) fell above the $574 support level before retracing on June 18.
Long-term forecast for the Binance Coin price: bearish
The cryptocurrency has consolidated above the current support level of $580 but below the moving average lines. BNB will retest the previous low of $560 if the bears break below the current support. The previous low of $560 has held since May 1, as reported by Coinidol.com before.
BNB will bounce if it retraces above the $560 support. The altcoin will rise and a break above the moving average lines will propel it into the positive trend zone. BNB will rise to its previous high of $635. In the meantime, the value of BNB stands at $584.50.
BNB indicator reading
After the current dip, the price bars are below the moving average lines but above the support at $580. In addition, doji candlesticks have appeared above the existing support, slowing down the price movement. Despite the cryptocurrency’s decline, the moving average lines have remained horizontal.
Technical indicators:
Key resistance levels – $600, $650, $700
Key support levels – $400, $350, $300
What is the next direction for BNB/USD?
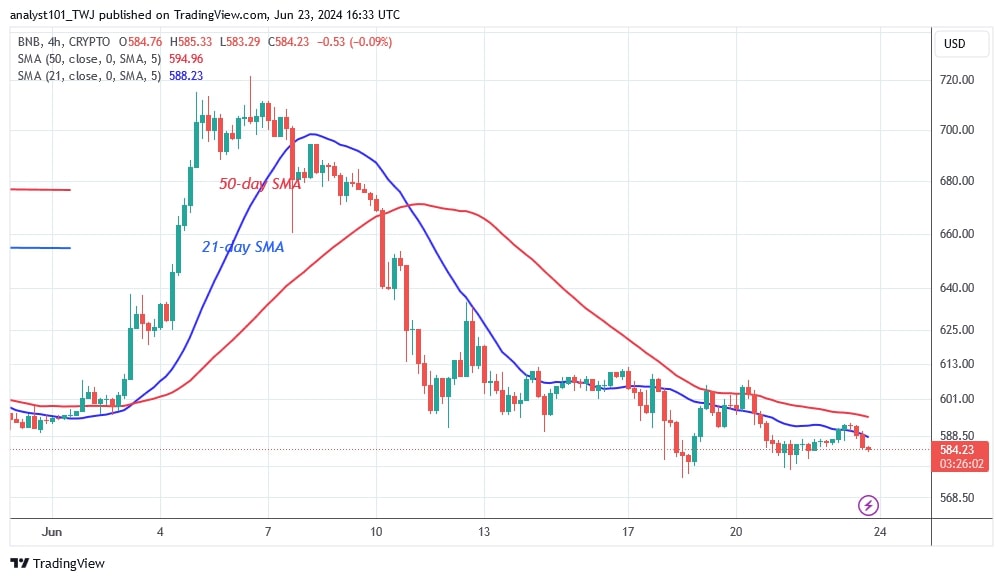
BNB is trading sideways on the 4-hour chart after its recent decline. The price of the altcoin is fluctuating between $570 and $600. BNB is falling slightly after being rejected at the moving average lines. The decline has paused due to the doji candlesticks above $580.

Disclaimer. This analysis and forecast are the personal opinions of the author and are not a recommendation to buy or sell cryptocurrency and should not be viewed as an endorsement by CoinIdol.com. Readers should do their research before investing in funds.


