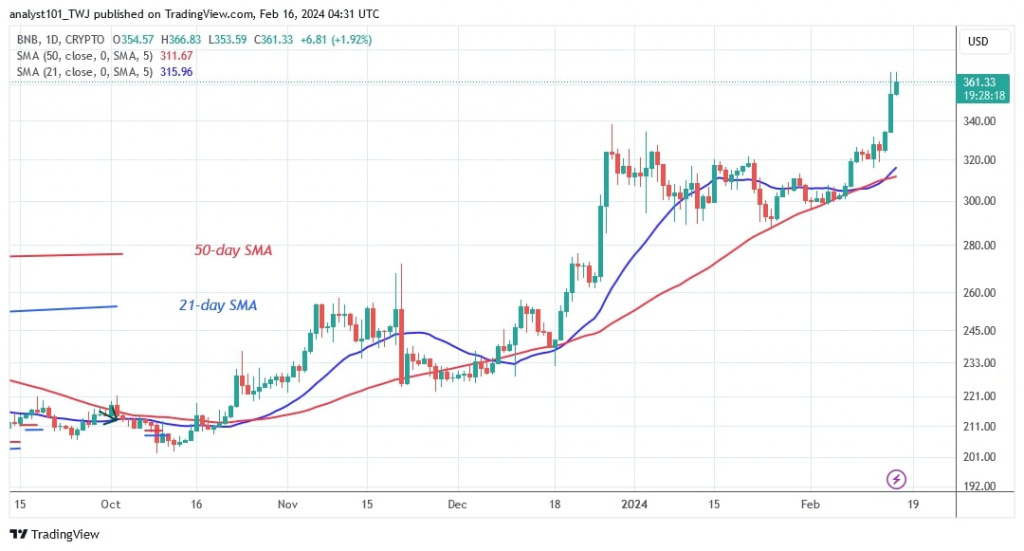
The price of Binance (BNB) coin has continued its uptrend after breaking out of its trading range of $290 to $330.
Binance coin price long term forecast: bullish
On February 15, the bulls broke through the $330 resistance level to hit a high of $366.67. However, the bulls bought the dips and pushed the crypto price higher from its support level of $349. BNB is now at $362.78. The upward movement has paused at a price level of $365. BNB is predicted to rise to a high of $400 if the current resistance is broken. However, if the altcoin falls back below the $330 support, it will fall into the previous range zone.
BNB indicator reading
BNB has been in the bullish trend zone since its return on February 15. The altcoin will continue to rise as long as the price bars remain above the moving average lines. In the meantime, the horizontal moving average lines are sloping upwards, indicating an uptrend.
Technical indicators:
Key resistance levels – $300, $350, $400
Key support levels – $200, $150, $100
What is the next direction for BNB/USD?
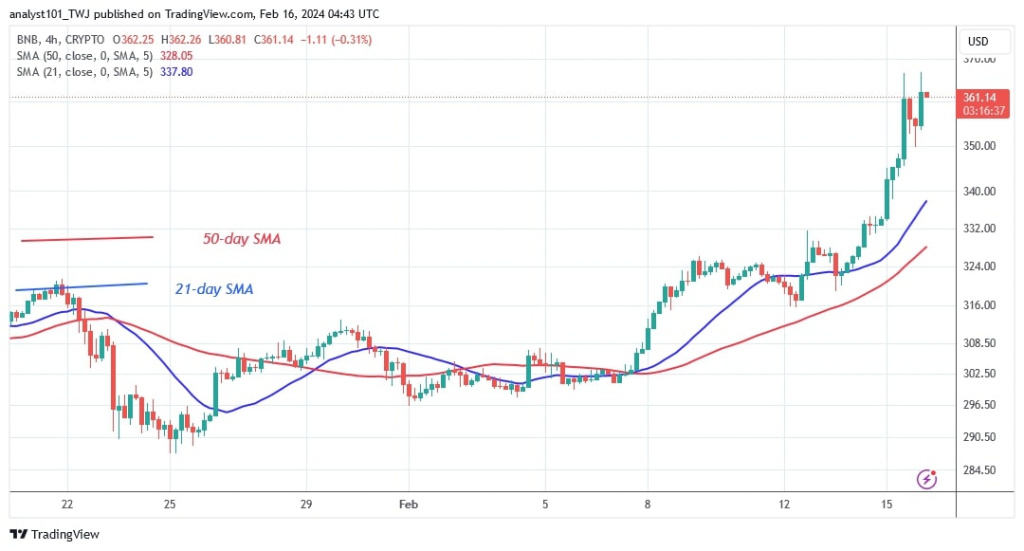
BNB has resumed its uptrend on the 4-hour chart after its recent breakout. The price of the cryptocurrency is still struggling to overcome resistance at $365. BNB has retested the current resistance twice but failed to break through it. The uptrend will resume once the resistance is broken.

Disclaimer. This analysis and forecast are the personal opinions of the author and are not a recommendation to buy or sell cryptocurrency and should not be viewed as an endorsement by CoinIdol.com. Readers should do their research before investing in funds.


