


- Ethereum price consolidation has resulted in an ascending triangle setup.
- This technical formation forecasts a 45% upswing on the breakout of the $2,000 psychological level.
- A flip of the $1,639 support level will invalidate the bullish thesis for ETH.
Ethereum (ETH) price shows a tight consolidation on the three-day chart. As this rangebound movement nears a breakout, investors need to be extremely cautious of Bitcoin (BTC) bears, who could flip the plan on its head.
Also read: Ethereum Layer 2 Optimism beats MATIC to the curb, sees massive spike in active addresses
Ethereum price edges closer to a breakout
Ethereum price has shown resilience over the past few months as it hovered between the $1,000 and $2,000 psychological levels. During this time, ETH has set up nearly four equal highs and four higher lows.
Connecting these swing points using trend lines reveals an ascending triangle setup. This technical formation forecasts a 45% ascent on the breakout of the horizontal resistance at nearly $2,000. The target of $2,915 is obtained by adding the measured distance to the breakout point.
As Ethereum price gets squeezed at the triangle’s apex, a volatile breakout is to be expected from ETH holders. The upswing might be prematurely stopped at the $2,439 hurdle, which would amount to a total gain of nearly 28% from the current price at $1,908.
The Relative Strength Index, which has flipped above the mean line, the Awesome Oscillator and the Wave Trend indicators have remained bearish. Still, the Wave Trend indicator suggests that a bullish crossover could occur soon.
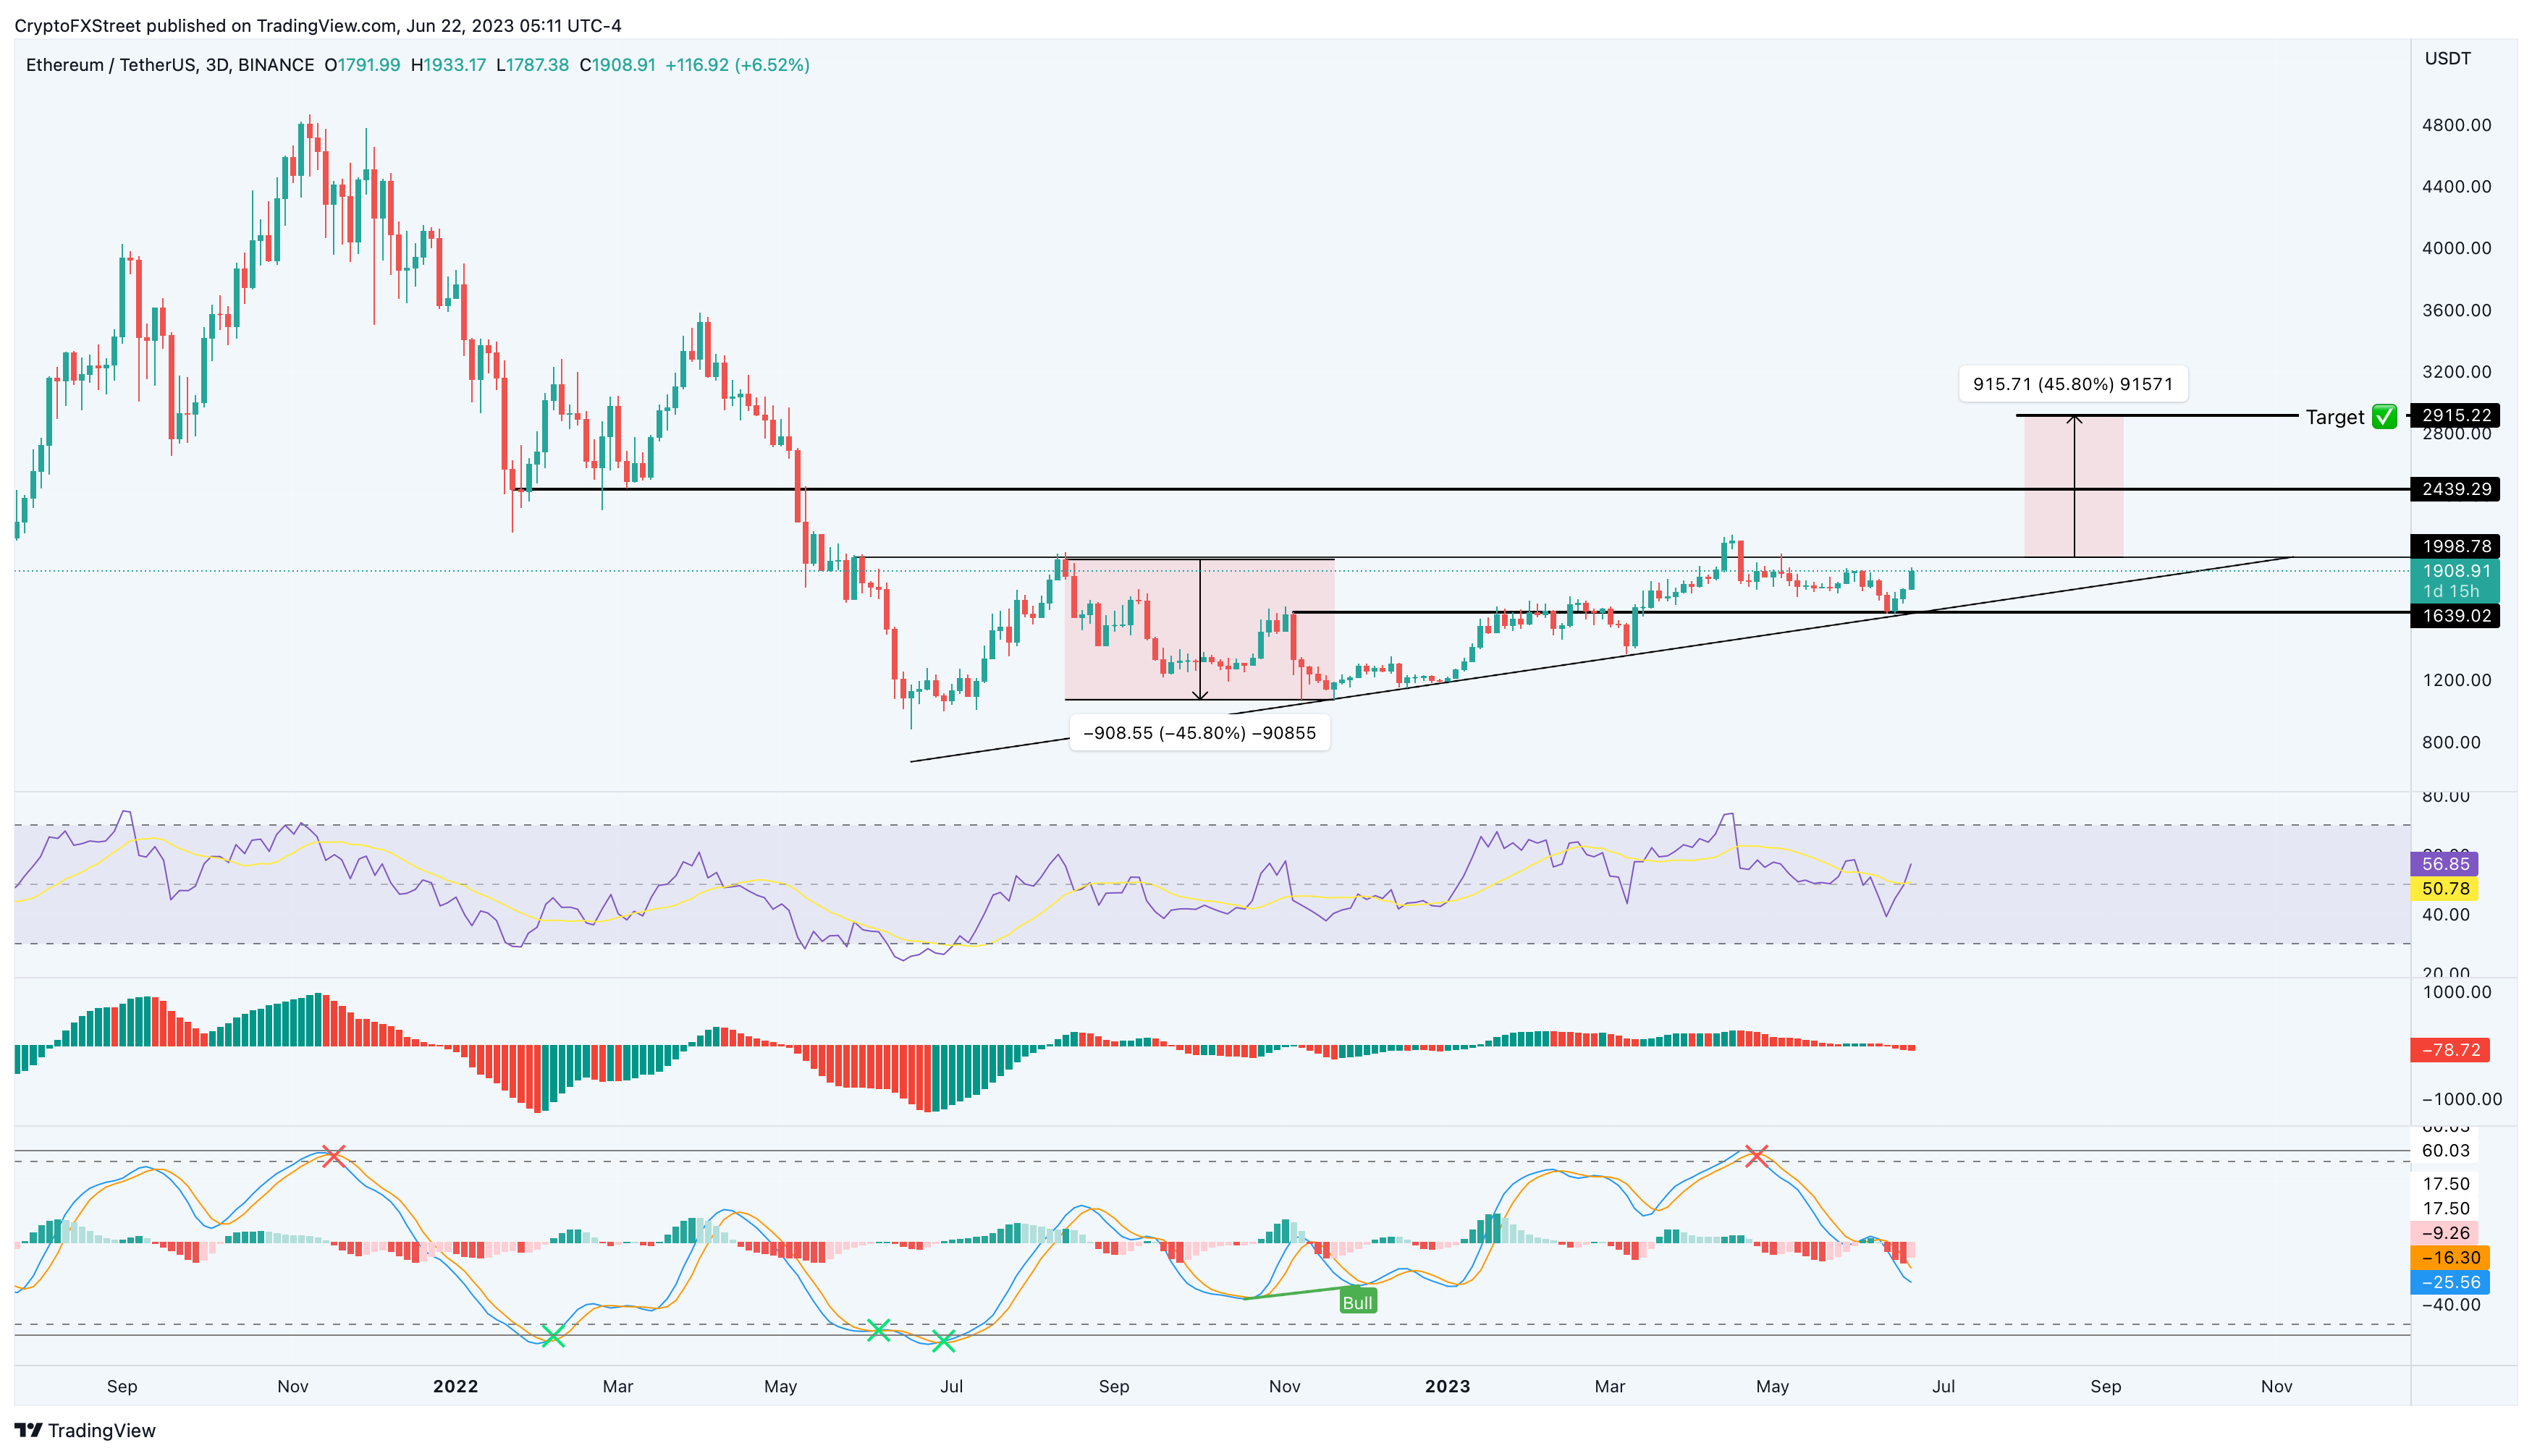
ETH/USDT 3-day chart
On the other hand, if Ethereum price produces a three-day candlestick close below the $1,639 support level, it will create a lower low and invalidate the bullish thesis for ETH. Such a development could see the altcoin revisit the $1,500 psychological level.
In a worse-case scenario, Ethereum price could slide as low as the $1,368 registered on March 8.
 Jumps by 7% Daily, Bitcoin (BTC) Eyes $85K Again (Market Watch)")

")
 Jumps by 7% Daily, Bitcoin (BTC) Eyes $85K Again (Market Watch)")
")

