- Bitcoin price continues to delay its bearish descent as BTC hovers around $27,963.
- Ethereum price consolidates around $1,892 with no directional bias in sight.
- Ripple price hits its inverse head-and-shoulder target at $0.515 after a 13% upswing in the last three days.
Bitcoin (BTC) price action slows down, allowing bears to doubt their strength. As more time elapses, the chances of bulls taking over control of BTC become more likely. A spillover effect, should buyers make a comeback, would be noticeable in Ethereum (ETH) and Ripple (XRP) prices.
Also Read: Bitcoin mining emission approaches net carbon negative as Texas cancels mining curbing bill
Bitcoin price could flip either way
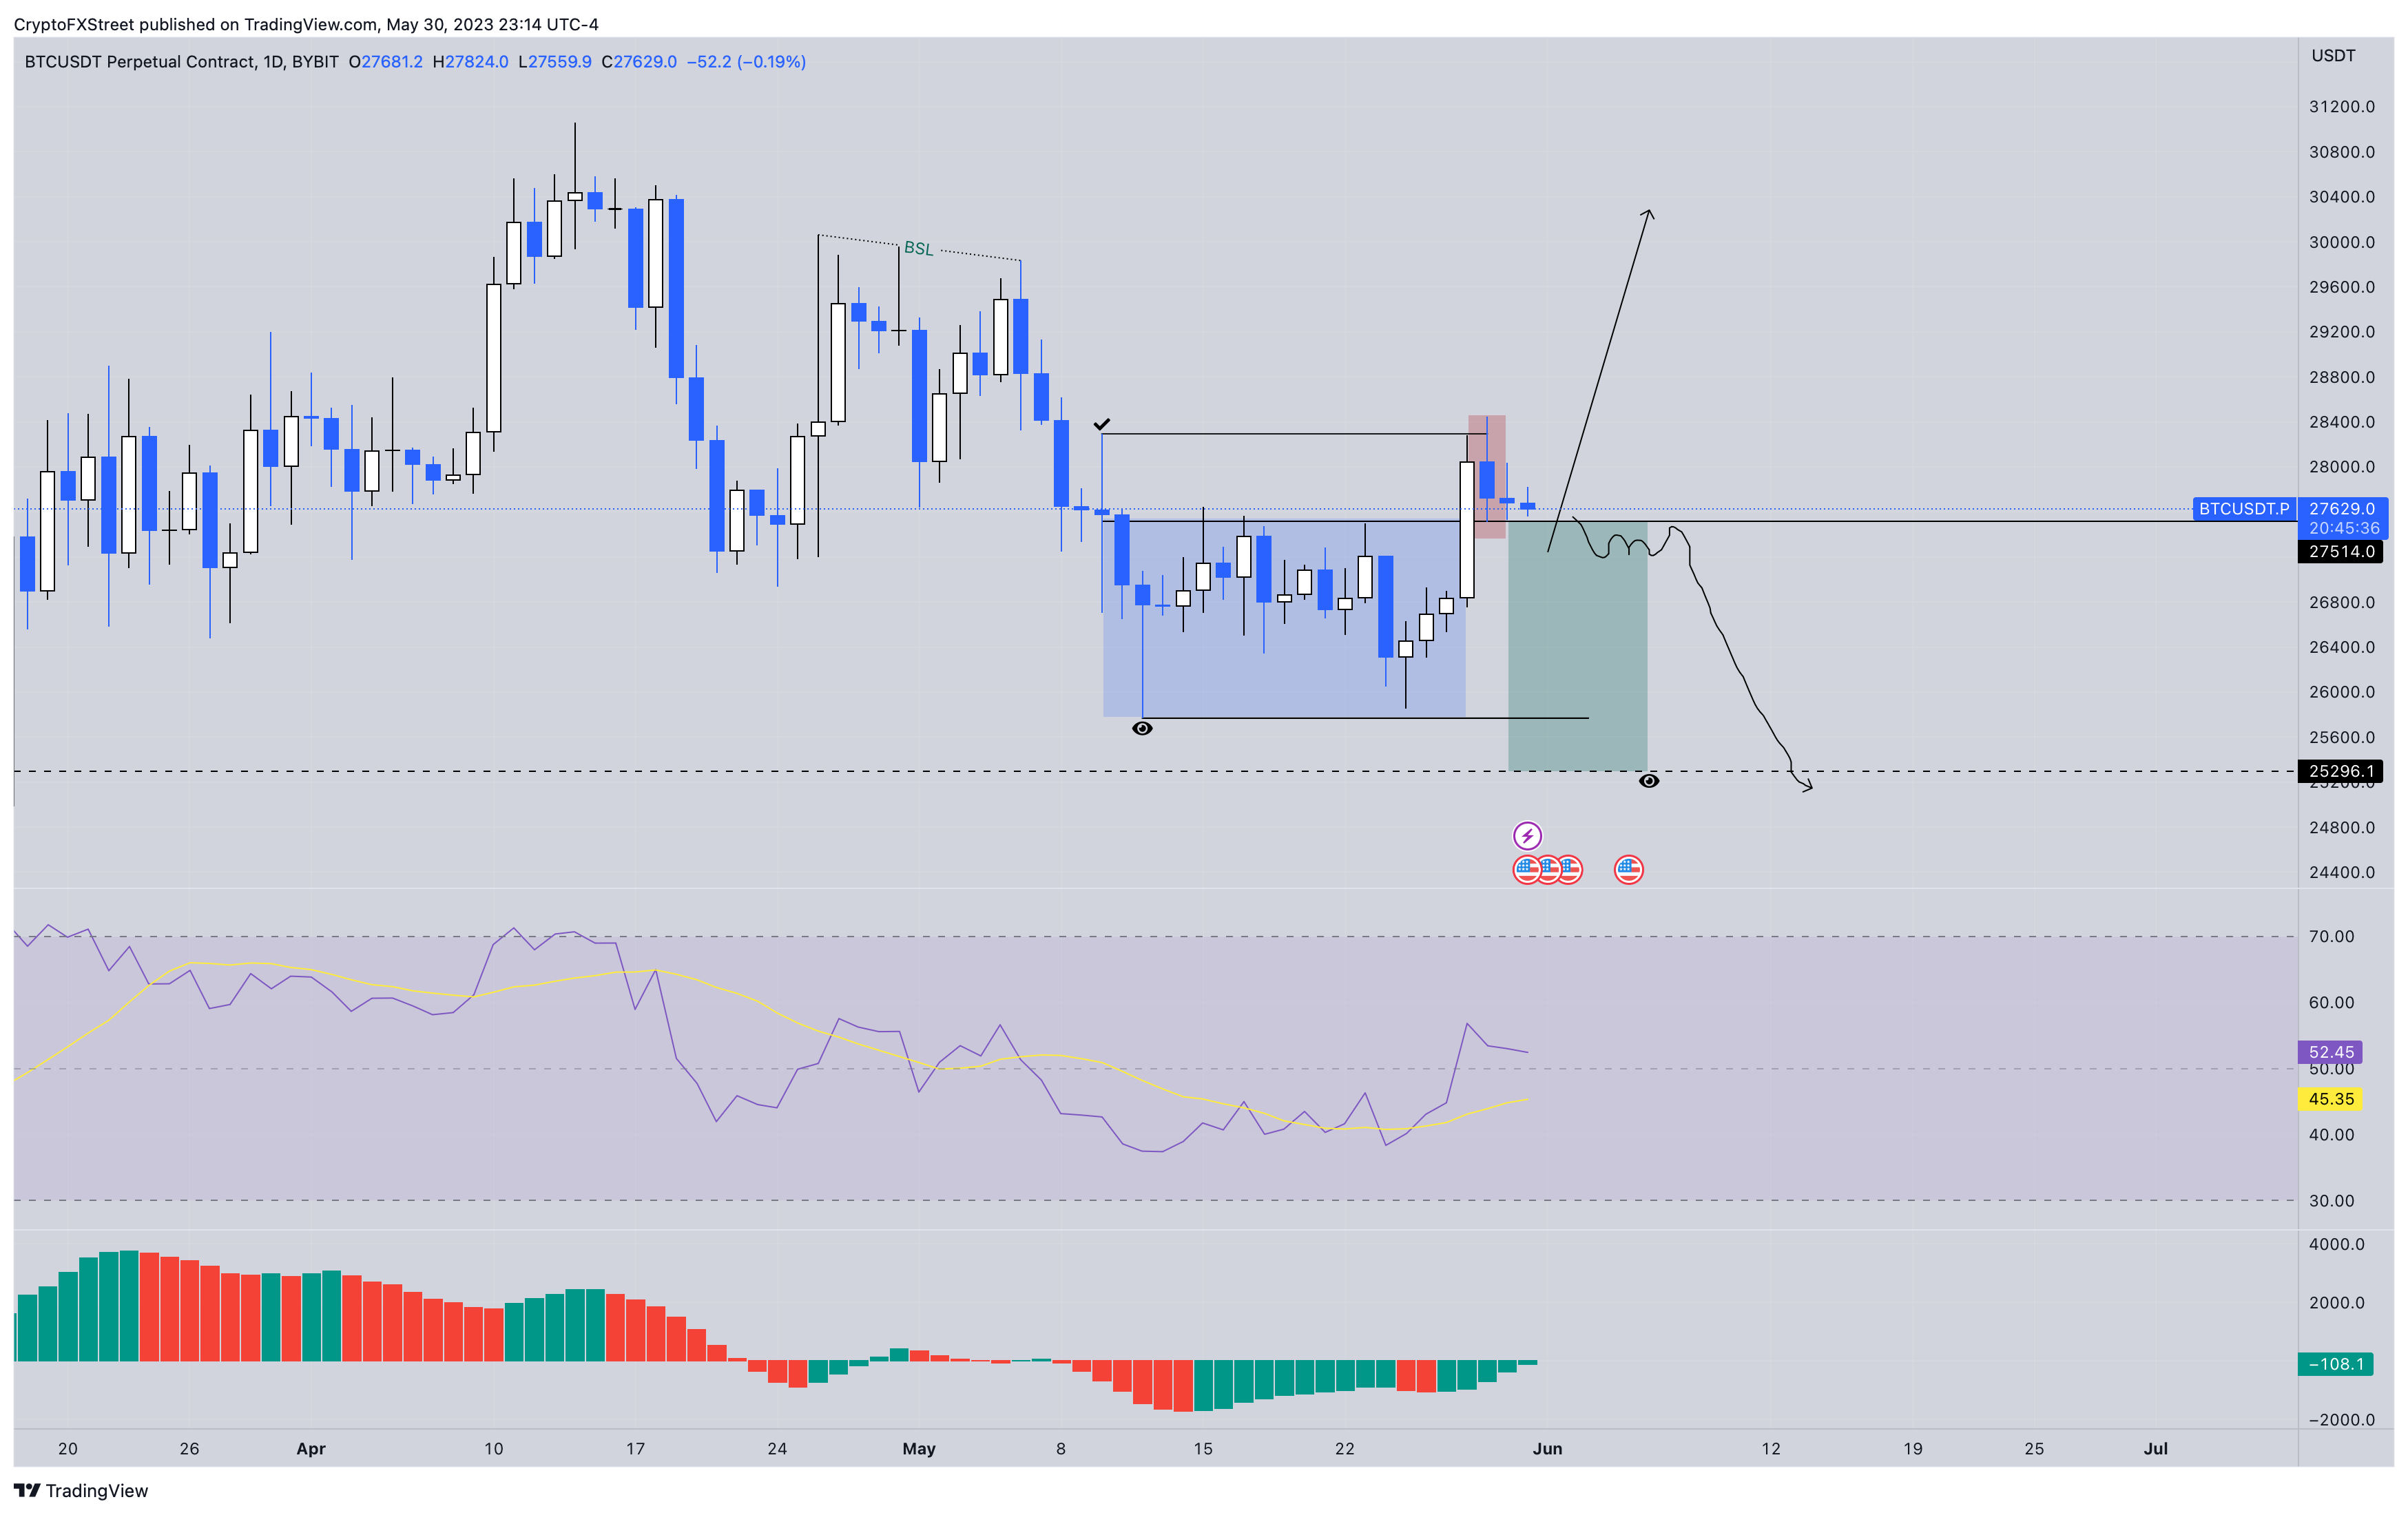
Bitcoin price looks ready to trigger the Power of Three (PO3) setup, as explained in the previous article. But for the pattern to yield a bearish move, BTC needs to flip the $27,514 support floor into a resistance level.
If this confirmation fails to arrive, the chances of a bounce are high, especially considering that the Relative Strength Index has recent flipped above the mean line and the Awesome Oscillator is about to do the same with the zero line. Both momentum indicators are suggesting a rise in the presence of bulls, which could trigger a bounce off the $27,514 support level, targeting the buy-stop liquidity resting above the swing highs formed on April 26 and May 6.
In such a case, investors can expect Bitcoin price to tag the $30,000 psychological level.
BTC/USD 1-day chart
Regardless of the forecast, Bitcoin price will provide a signal on where it will head next. The bearish outlook will kickstart if the $27,514 support barrier is breached. In such a case, the PO3 setup could catalyze a sweep of the $25,296 level for sell-stop liquidity.
Ethereum price lacks directional bias
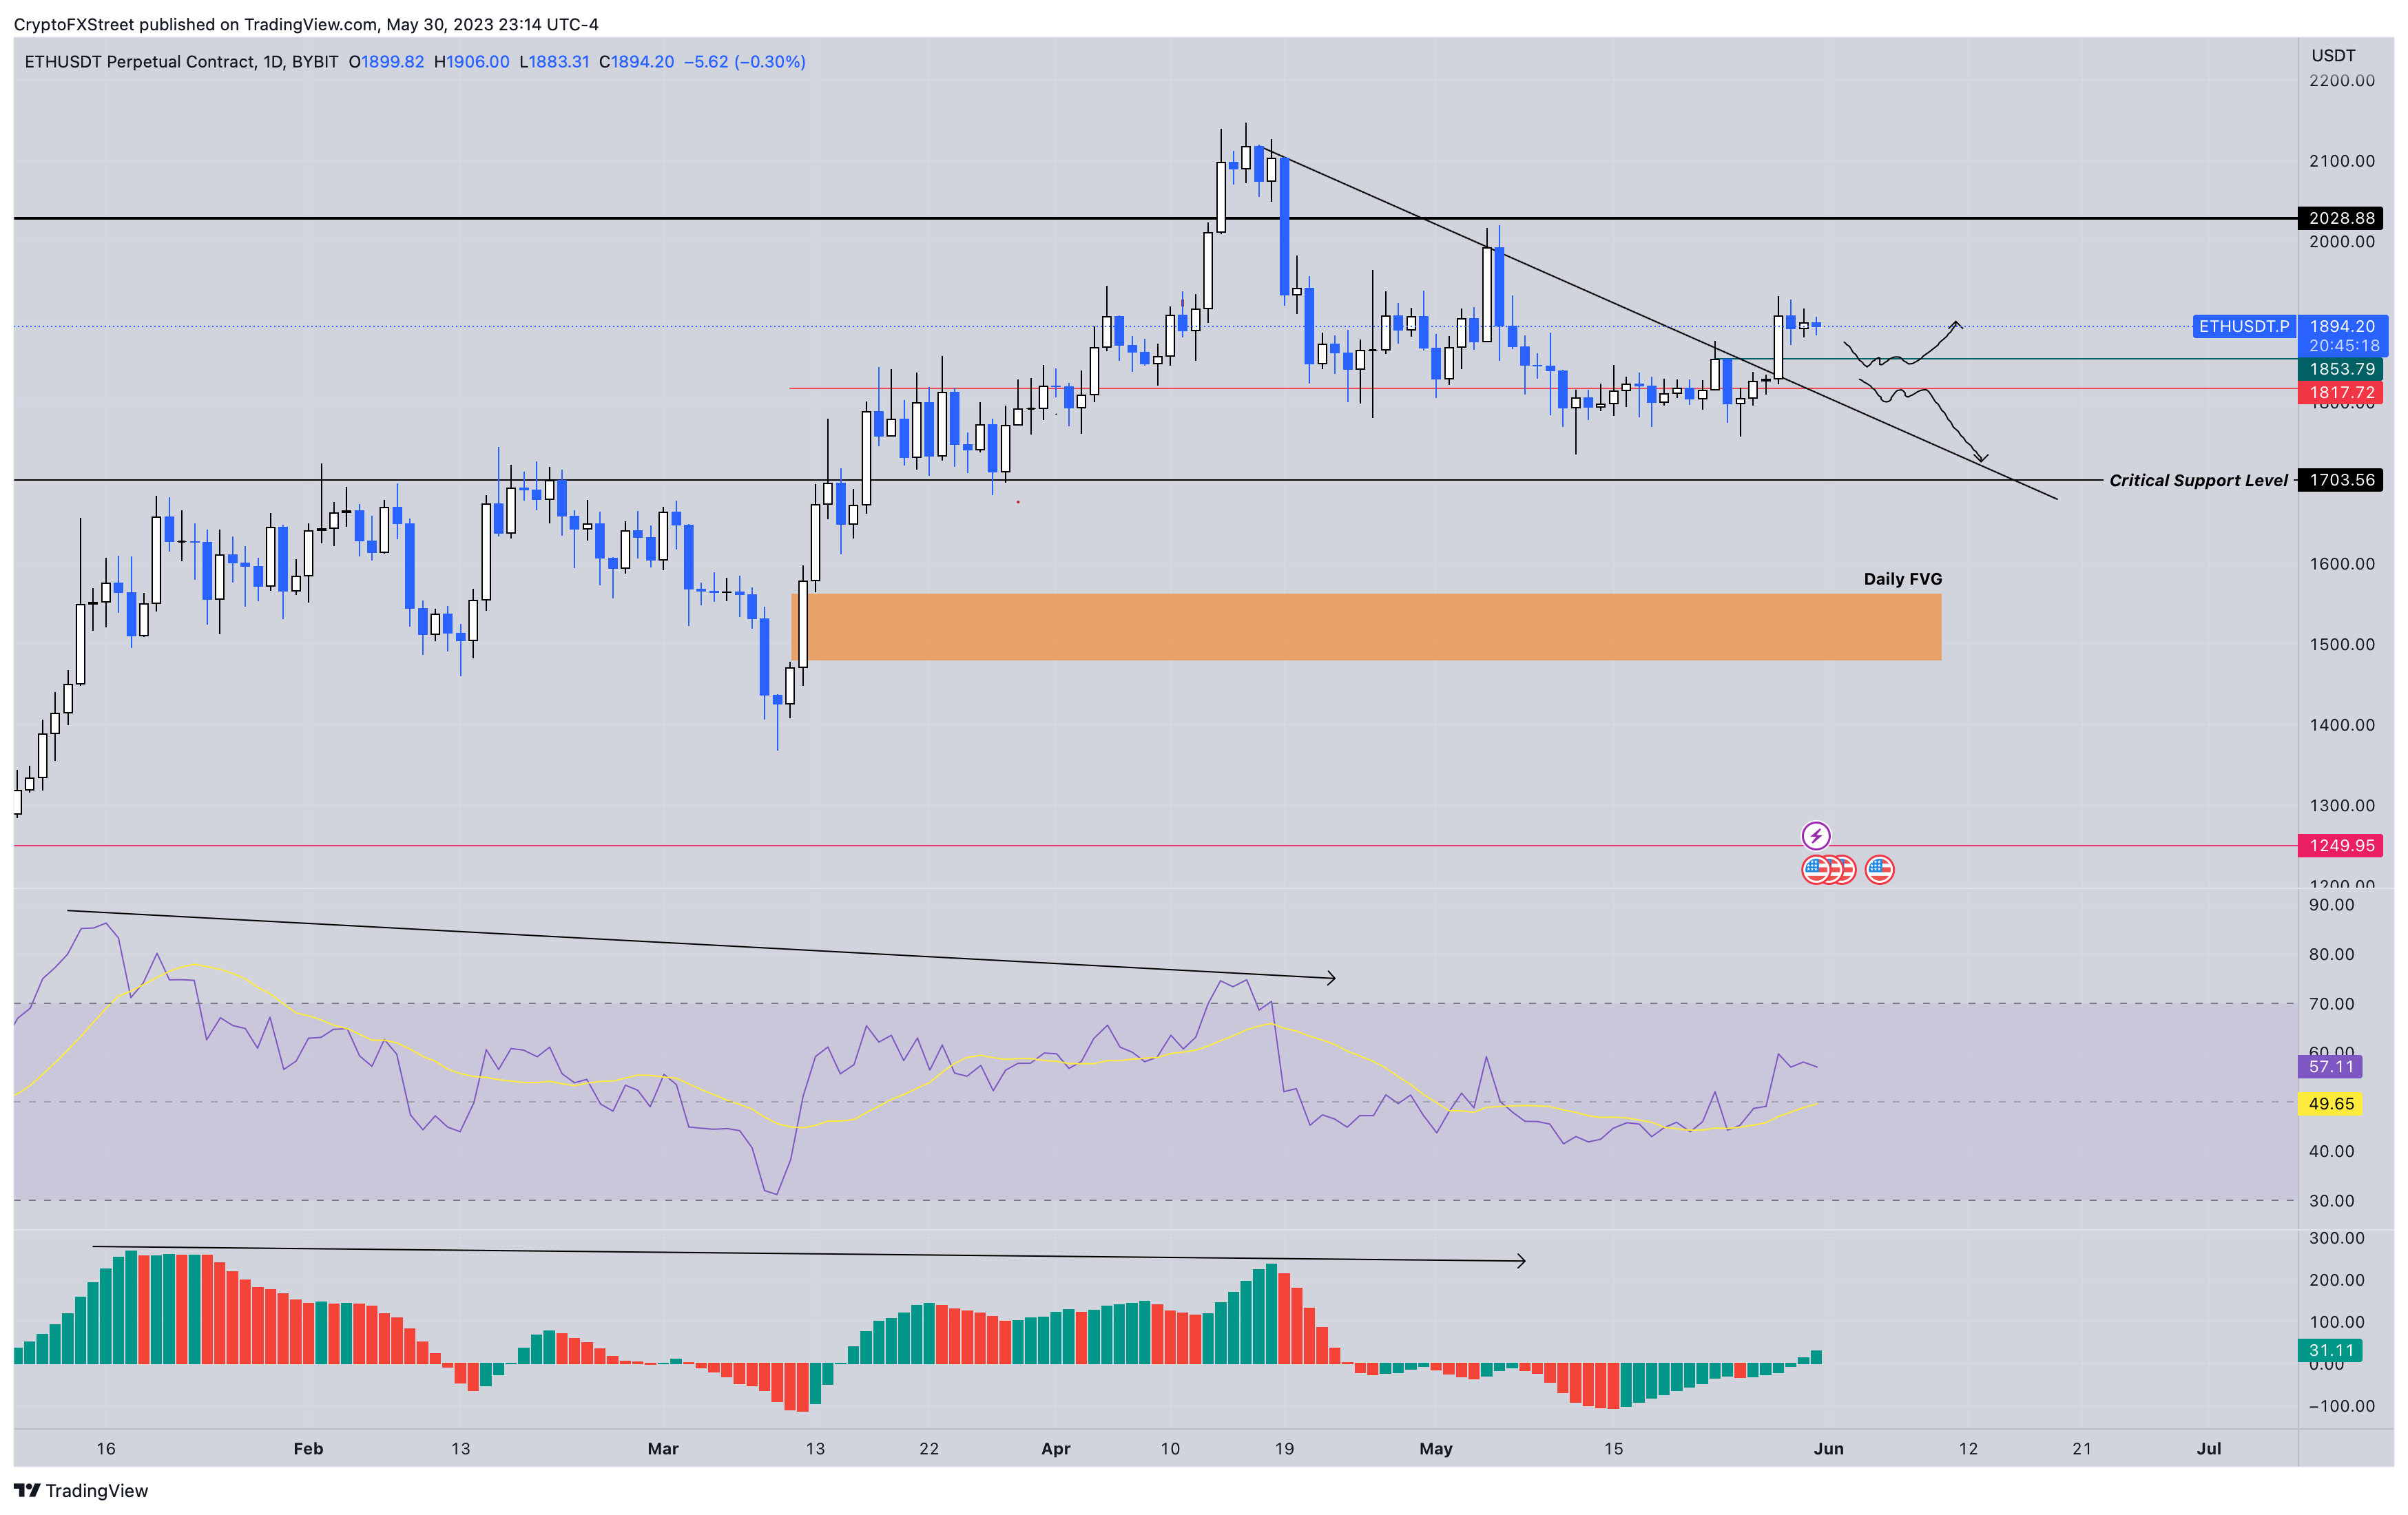
Ethereum (ETH) price rallied 6% on May 28, clearing a declining resistance level and has been consolidating around $1,894 since then. A pullback into the stable support level at $1,853 would be an opportunity for sidelined buyers to accumulate.
A bounce at this barrier could trigger ETH to rally 9.80% and tag the next critical hurdle at $2,028.
ETH/USD 1-day chart
While things are looking up for Ethereum price, a breakdown of the $1,817 support level will invalidate the bullish thesis. This move could trigger a 6.15% descent to $1,703 for ETH.
Ripple price hits its targets and then some
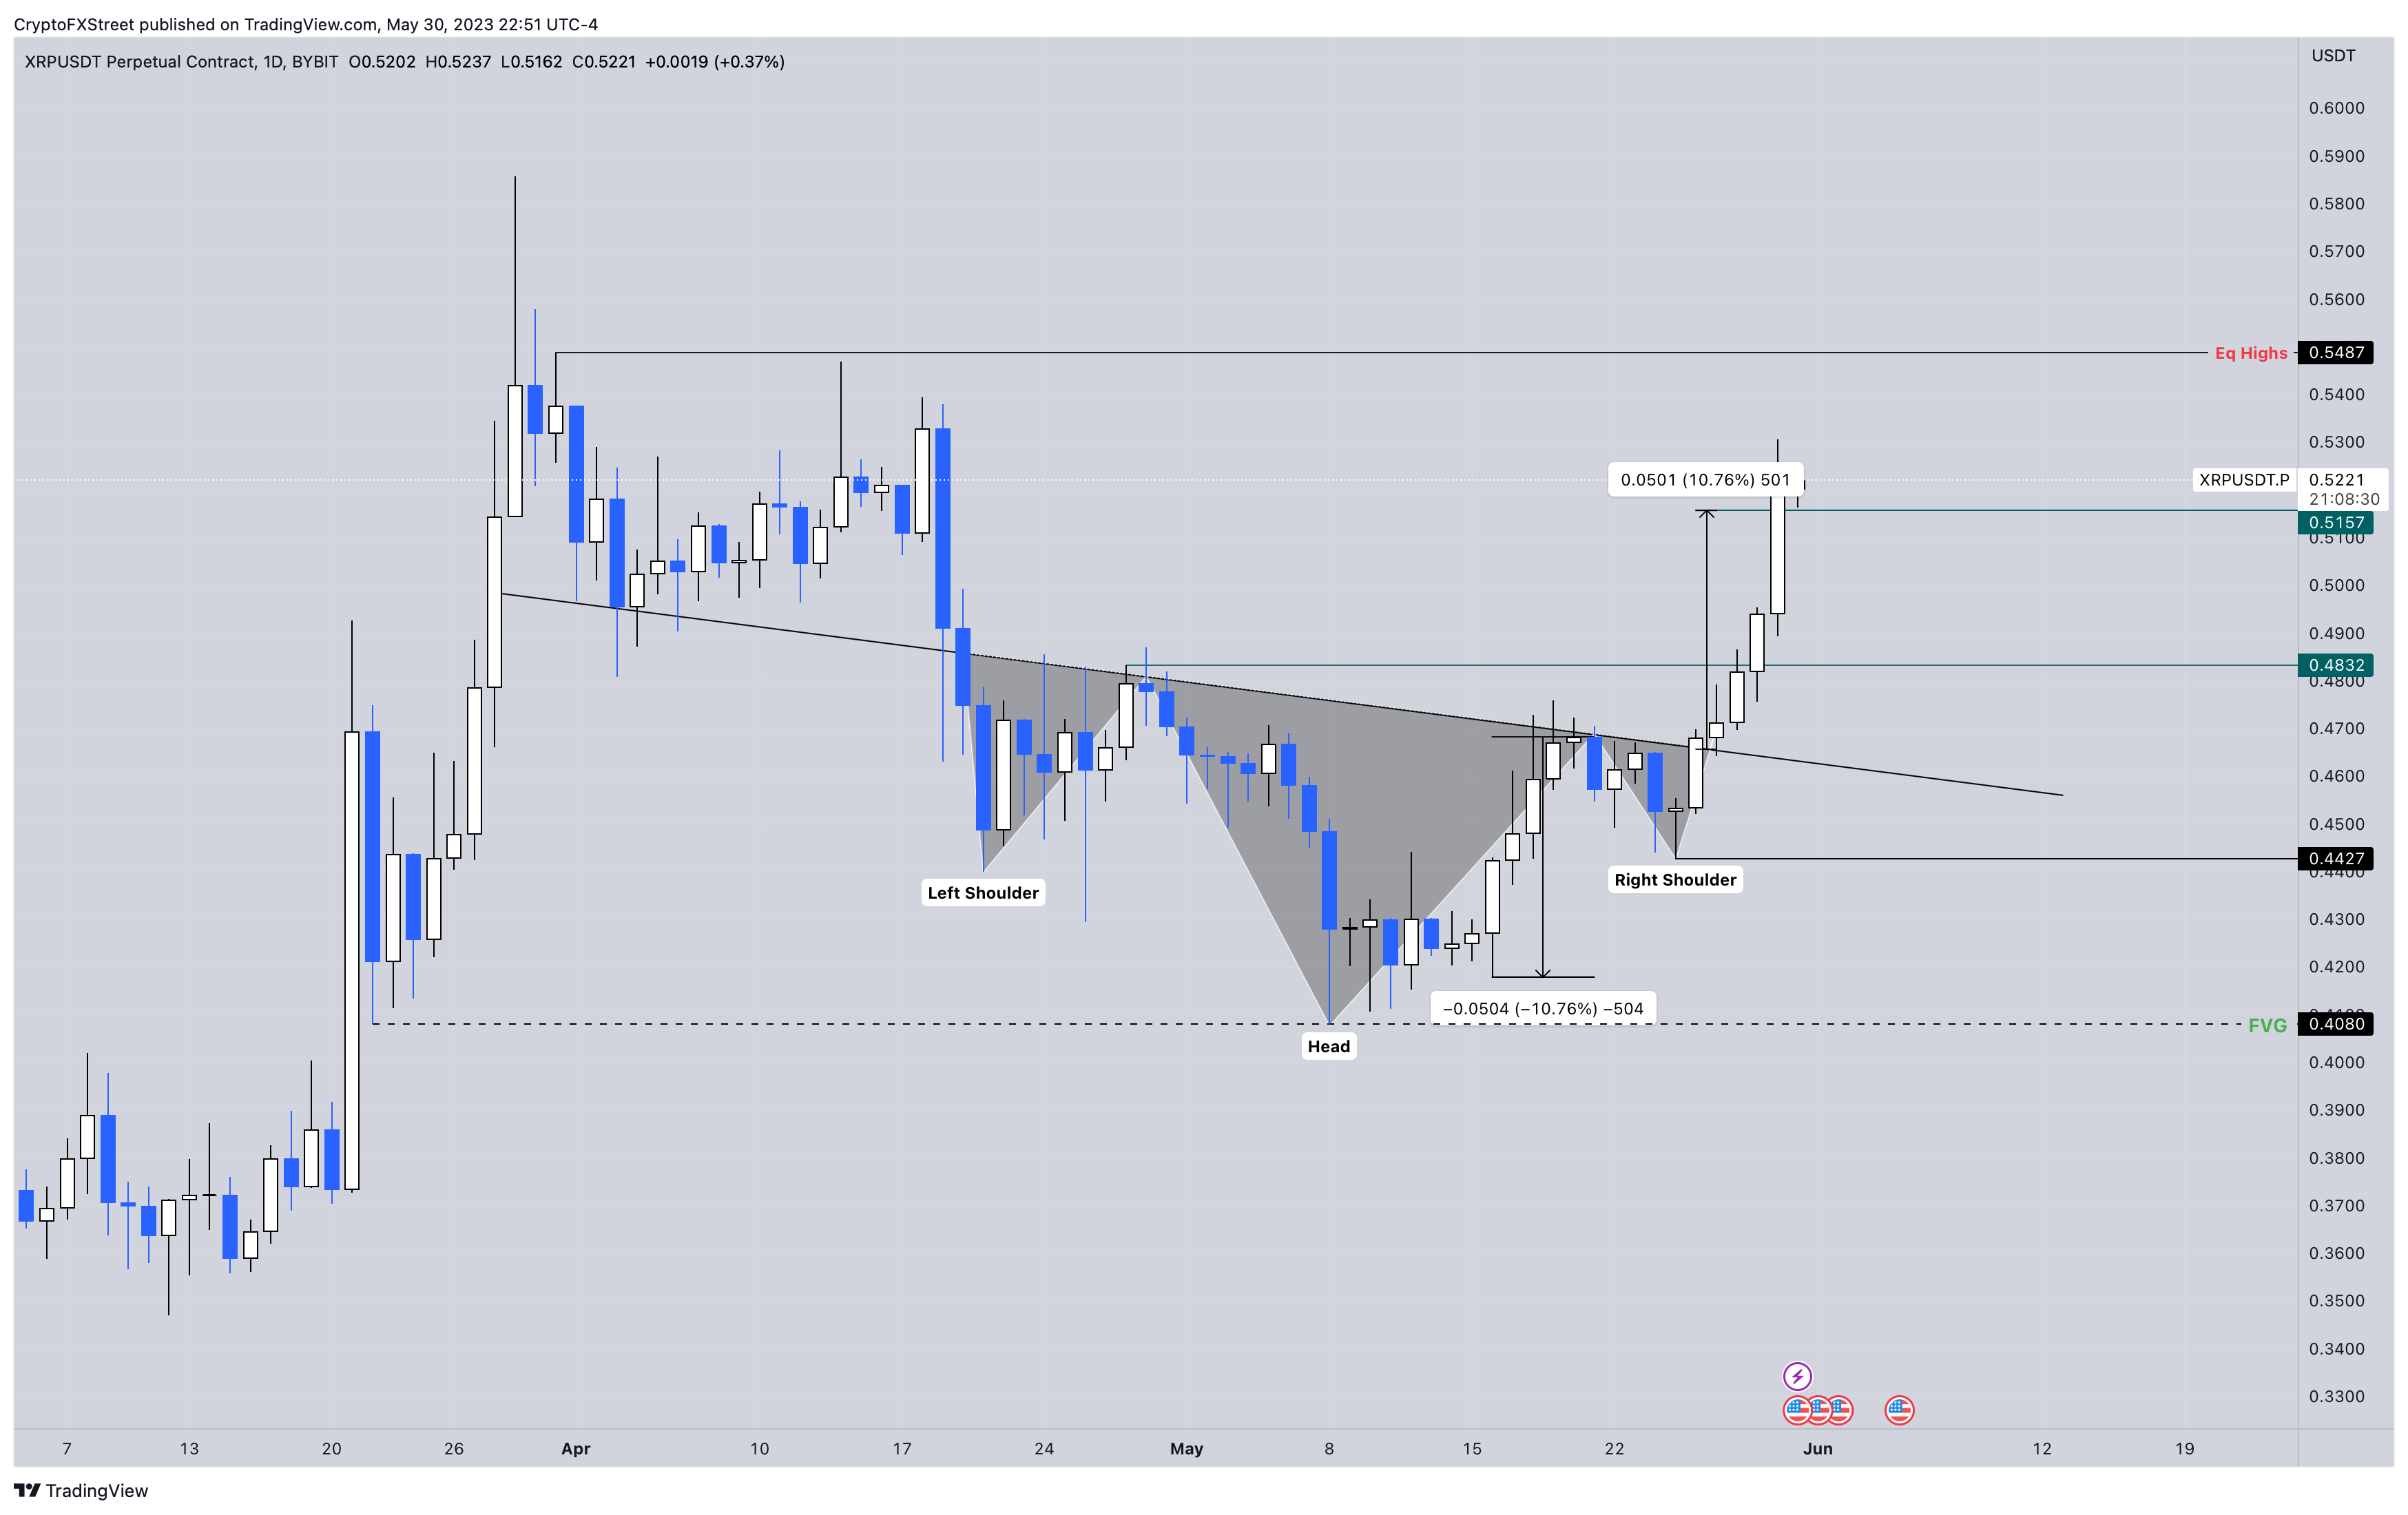
Ripple (XRP) price breached the inverse head-and-shoulder pattern at $0.466 on May 26. After this breakout, XRP price rallied a total of 13%, passing its target at $0.515. As a result, the remittance token set up a local top at $0.530.
As Ripple price hovers around $0.521, investors can expect a minor retracement to $0.482 before setting up a new bias.
The likely direction for XRP post-pullback would be the buy-stop liquidity above $0.548.
XRP/USD 1-day chart
On the other hand, if Ripple price breaches the neckline and produces a lower low below $0.442, it would invalidate the prevalent bullish thesis. In such a case, XRP price could trigger an 8% correction to $0.408.


