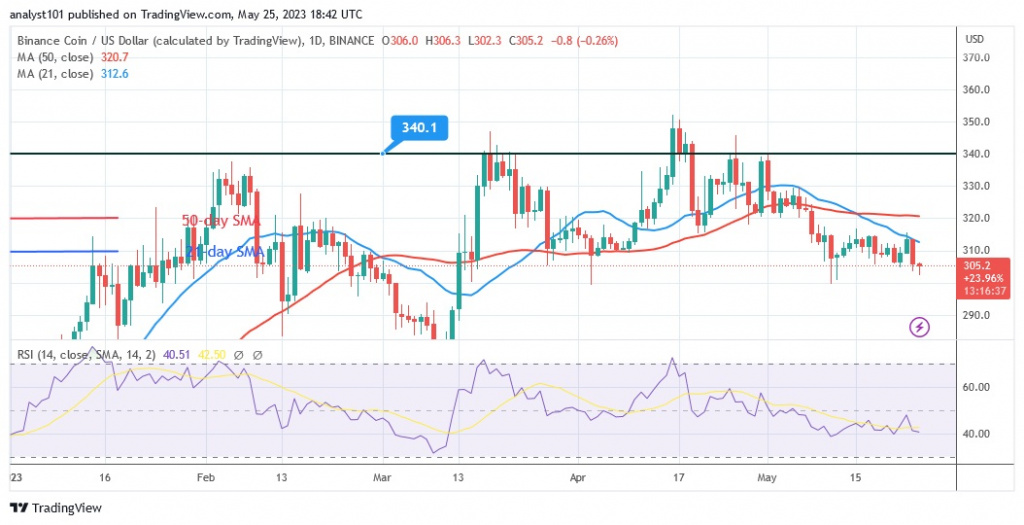
Binance Coin (BNB) has fallen above the current support level at $300.
Binance Coin price long term forecast: bearish
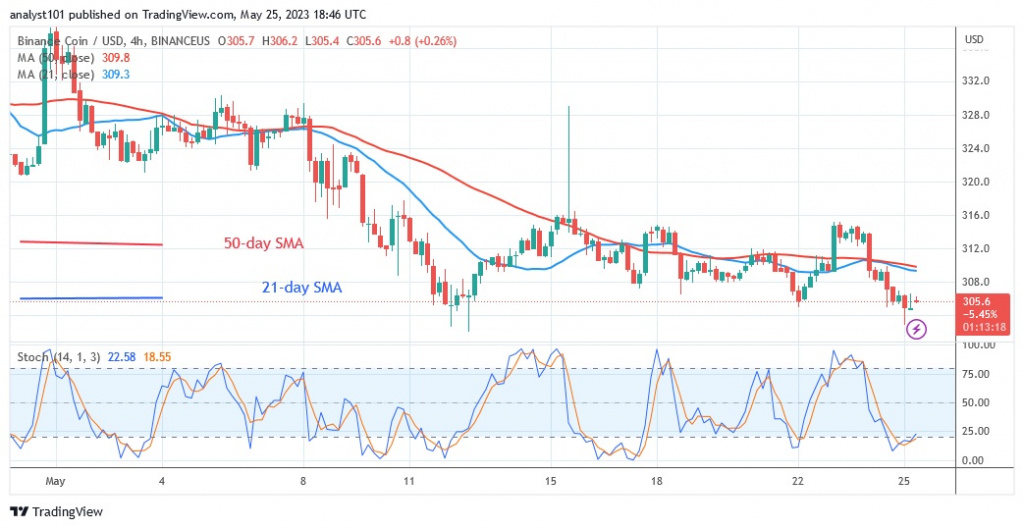
Since the price decline on May 11, the cryptocurrency asset has been trading above the current support but below the 21-day line SMA or resistance at $315. On the upside, buyers have been unable to keep the price above the moving average lines and resistance at $315. The 21-day line SMA stopped the upward movement. In the recent price action, buyers were successful as BNB rallied to the upper resistance at $340. At the time of writing, BNB is currently trading at $305.10. However, the bulls have been defending the existing support since the price declined on May 11. If the current support holds, BNB is likely to rise again. The resumption of an uptrend is indicated by a price increase. If the current support is broken, BNB will retest the previous low at $280.
Binance Coin indicator display
The price of BNB has remained constant at the 40 level of the Relative Strength Index for the 14 period. BNB is falling as the price bars are below the moving average lines. The price bars are currently encountering the resistance of the 21-day line SMA. The oversold area of the market is where altcoin is currently trading. BNB is below the stochastic level 20 on a daily basis.

Technical indicators:
Key resistance levels – $600, $650, $700
Key support levels – $300, $250, $200
What is the next direction for BNB/USD?
Binance Coin is trading above the $300 support despite the recent decline. The support has not been breached since March 15. It seems unlikely that the negative trend will continue as the altcoin has reached the oversold area of the market. However, in a competitive market, the support could be challenged.

Disclaimer. This analysis and forecast are the personal opinions of the author and are not a recommendation to buy or sell cryptocurrency and should not be viewed as an endorsement by CoinIdol. Readers should do their research before investing in funds.


