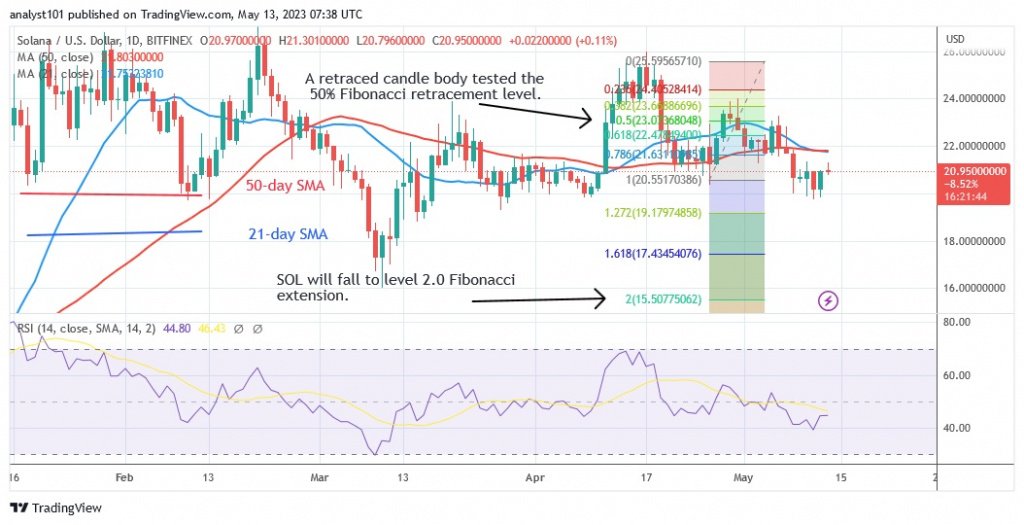
The price of Solana (SOL) is falling as it crosses below the 50-day line SMA. The move below the moving average lines signals that selling pressure continues.
Solana price long term forecast: bearish
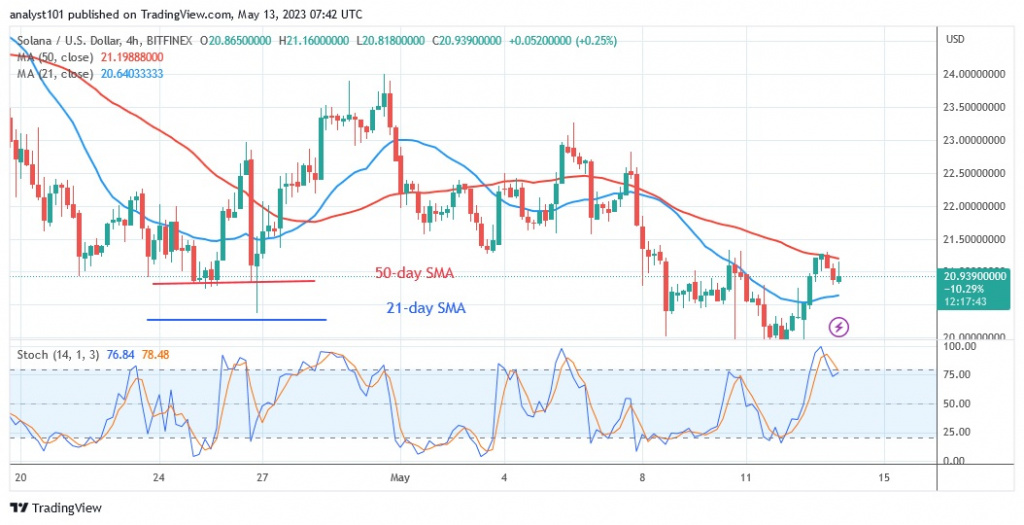
Solana hit a low of $20.01 on May 8 before starting to consolidate back above it. The altcoin is now selling at $20.98.
Solana is currently in a positive momentum, but is approaching the overbought area of the market. The $22 resistance zone is the point where the current rise is expected to be rejected. In addition, the market is overbought near the $22 high. If sellers appear in the overbought area, the cryptocurrency value is likely to fall.
Solana price indicator analysis
Solana’s Relative Strength Index is at 45 for the 14 period, and the altcoin is bearish and could fall further into downtrend territory. The current downtrend is due to the price bars falling below the moving average lines. The cryptocurrency has moved up into the overbought zone of the market. It is higher than the daily stochastic value of 80l. As long as the market is in the overbought zone, the altcoin will fall.

Technical indicators
Key supply zones: $60, $80, $100
Key demand zones: $50, $30, $10
What is the next step for Solana?
Solana is currently in a positive momentum, but approaching the overbought area of the market. The $22 resistance zone is the point where the current rise is expected to be rejected. In addition, the market is overbought near the $22 high. If sellers appear in the overbought area, the cryptocurrency value is likely to fall.

Disclaimer. This analysis and forecast are the personal opinions of the author and are not a recommendation to buy or sell cryptocurrency and should not be viewed as an endorsement by CoinIdol. Readers should do their own research before investing in funds.


