Binance Coin (BNB) price is sliding below the moving average lines.
Binance Coin price long term forecast: bullish
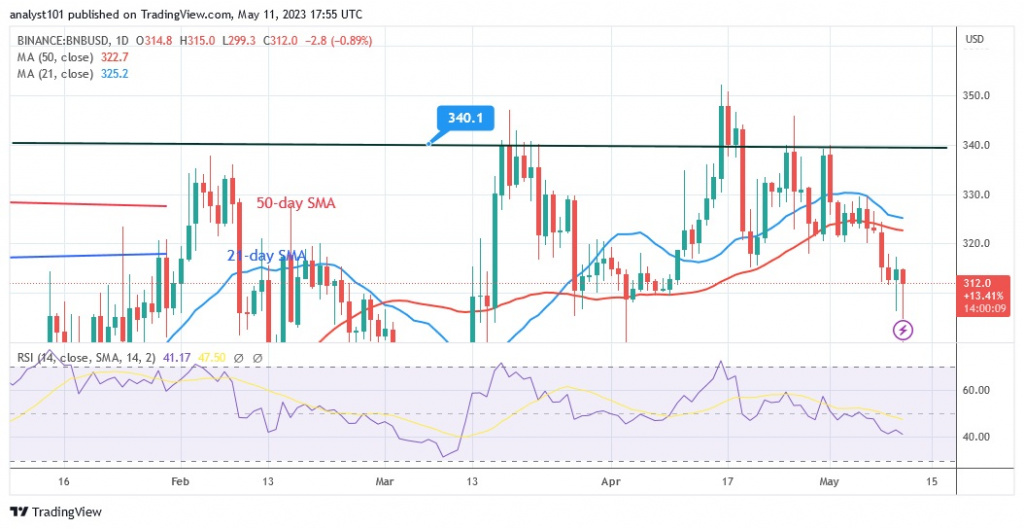
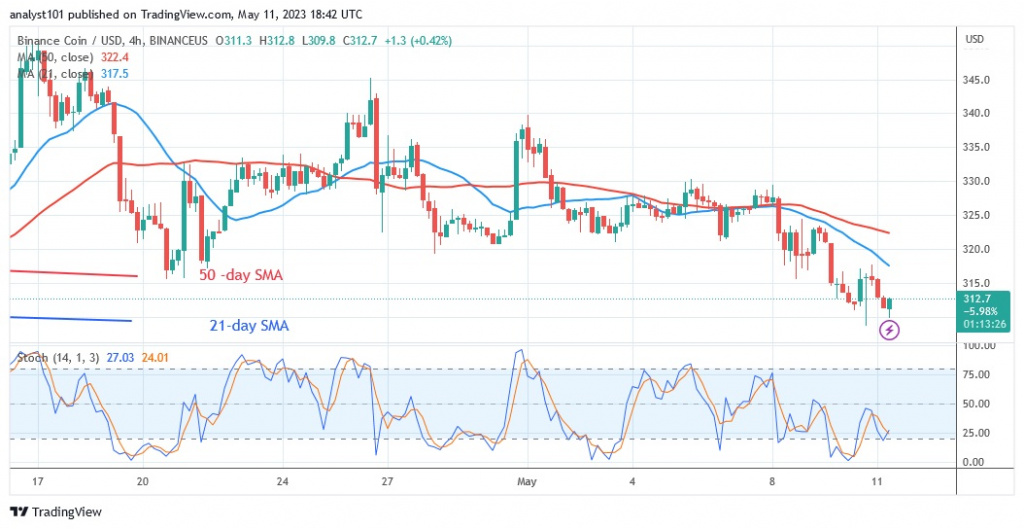
When the bears broke the 50-day line SMA, the altcoin was released from its previous trap between the moving average lines. After breaking the moving average lines, the bearish momentum picked up. Bulls bought the dips as the decline accelerated to a low of $299.30. Binance Coin is now trading at $312.30 after a reversal. The historical price level from March 15 is the $299 support area. On March 15, the altcoin rallied and reached the upper resistance at $340. Today, the altcoin is consolidating above the $310 support in anticipation of a probable uptrend. BNB will resume its uptrend if buyers keep the price above the moving average lines or the $330 barrier.
Binance Coin indicator display
On the Relative Strength Index for period 14, BNB is at level 41. After the breakdown, the altcoin is in a bearish trend zone. BNB is prone to decline as long as it is in the downtrend zone. The current decline is due to the price bars falling below the moving average lines. BNB is in a bearish momentum below level 30 of the daily stochastic.

Technical indicators:
Key resistance levels – $600, $650, $700
Key support levels – $300, $250, $200
What is the next direction for BNB/USD?
Binance Coin is currently trading in the bearish trend zone due to the recent decline. After the decline, the altcoin is now stabilizing above the $300 level. If the $300 support holds, the uptrend will continue. The market has now crossed the oversold level and no further selling pressure is expected.

Disclaimer. This analysis and forecast are the personal opinions of the author and are not a recommendation to buy or sell cryptocurrency and should not be viewed as an endorsement by CoinIdol. Readers should do their research before investing in funds.


