Bitcoin (BTC) price is bearish and crossing below the moving average lines.
Bitcoin price long-term forecast: bearish
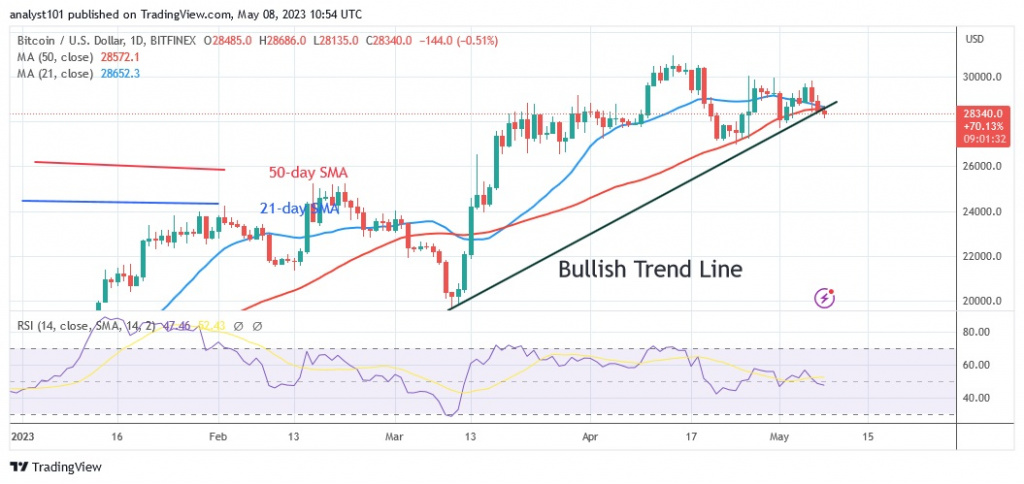
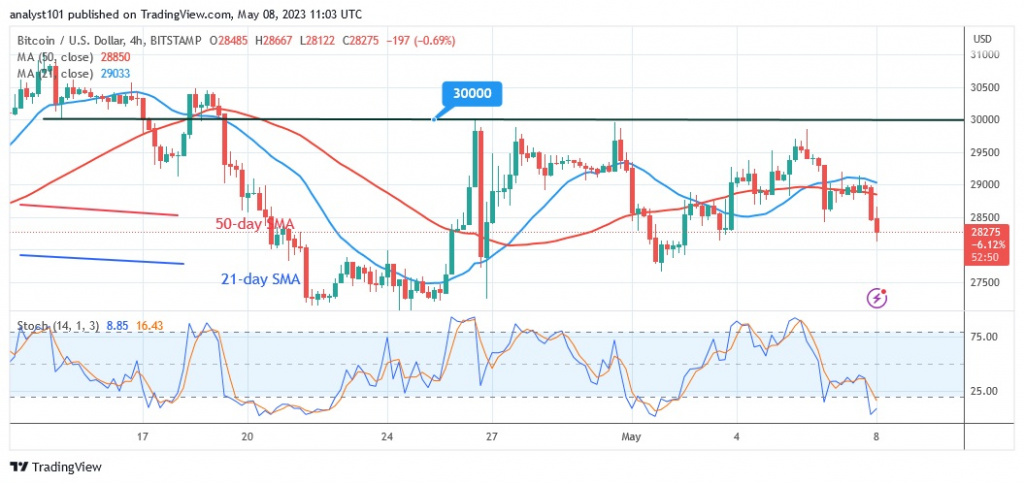
If the moving average lines are broken, the bitcoin price could fall even further. At the time of publication, a low of $27,814 was reached for one bitcoin. If the price breaks the $28,000 support level, selling pressure could increase. The value of the crypto asset has been fluctuating between $28,000 and $30,000 since April 26, and if the current support is broken, the BTC price will fall until it reaches the following support, which is $27,000. If buyers fail to secure the critical support levels, selling pressure could eventually reach a low of $25,200. In contrast, the uptrend will resume if Bitcoin holds its position above the $28,000 support level. In the last price action, when the BTC price crossed the moving average lines, Bitcoin surged and recovered to the psychological price level of $30,000. Today’s decline is due to the bulls’ inability to maintain their bullish momentum above the $30,000 level. Since then, bitcoin has fallen below the $28,000 support level.
Bitcoin indicator display
On the Relative Strength Index for the 14 period, Bitcoin is at level 45. The cryptocurrency asset has slipped into the downtrend zone and could fall further. The price bars are below the moving average lines, which indicates that the BTC price will continue to fall. The cryptocurrency has reached the oversold zone of the market. The daily stochastic is currently below the 20 level, and it is conceivable that the selling pressure will ease.

Technical indicators:
Key resistance levels – $30,000 and $35,000
Key support levels – $20,000 and $15,000
What is the next direction for BTC/USD?
The largest cryptocurrency broke through the $28,000 threshold before continuing to decline. The current slide has reached the oversold area of the market. Selling pressure is likely to ease as the market approaches the oversold area. In an oversold sector, buyers appear to be driving prices higher.

Disclaimer. This analysis and forecast are the personal opinions of the author and are not a recommendation to buy or sell cryptocurrency and should not be viewed as an endorsement by CoinIdol. Readers should do their research before investing in funds.


