The altcoin will face harsh rejection at its recent high.
Long-term analysis of the Ethereum price: bullish
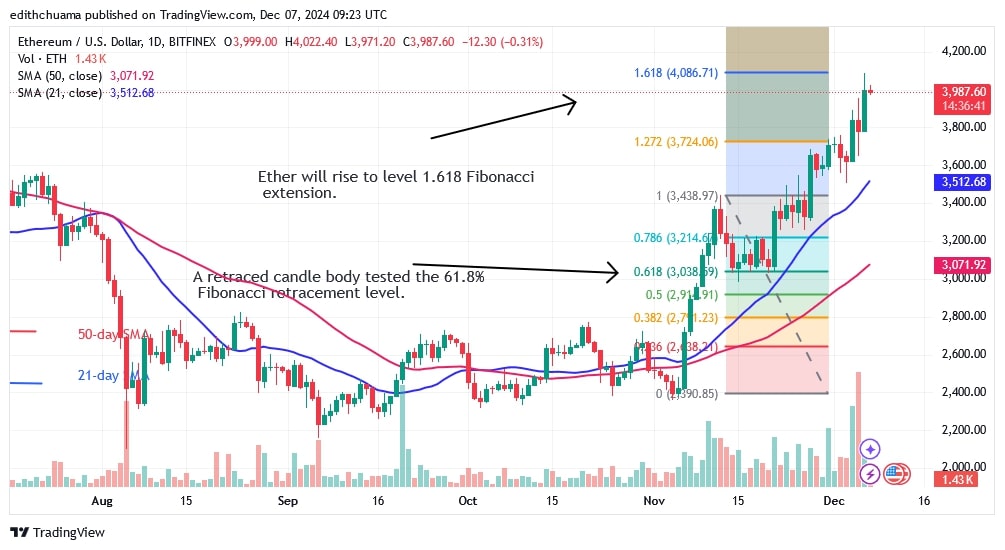
The Ethereum (ETH) market reached the psychological price barrier of $4,000 on December 6. The price indicator predicts that the altcoin will reach the 1.618 Fibonacci extension or the high of $4,086.71.
On the positive side, the price of the cryptocurrency could continue to rise and break through the 4,000 dollar mark. This would take the altcoin to a high of $4,500. If Ether falls back from its recent high, it will rise above the 21-day SMA but fluctuate below the $4,000 mark. Meanwhile, it is trading below the $4,000 high.
ETH indicator analysis
Ether is in an uptrend, with the 21-day and 50-day SMAs sloping north. The price bars are above the upward sloping moving average lines. The uptrend is characterised by doji candlesticks, which slow down the price movement. The flow ends when the price bars fall below the moving average lines.
Technical Indicators:
Key Resistance Levels – $4,000 and $4,500
Key Support Levels – $3.500 and $3,000
What is the next direction for ETH?
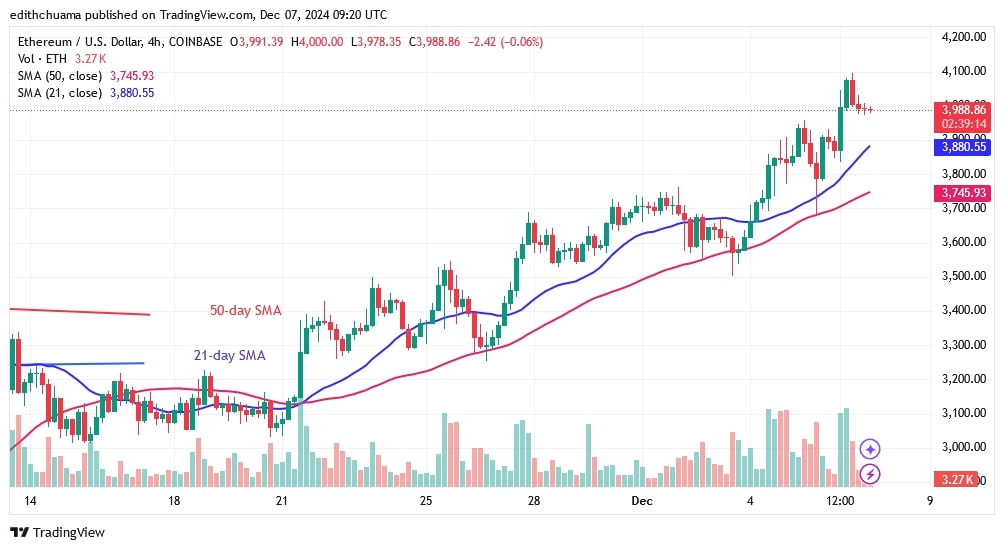
Ether is in a gentle uptrend on the 4-hour chart and has risen to a high of $4,000. Ether is showing a pattern of rising highs and lows. The price action continues and includes both small and large diameter candles. The bullish momentum has paused after reaching a high of $4,100.
The upward trend will continue when the altcoin recovers and breaks through the psychological price barrier.

Disclaimer. This analysis and forecast are the personal opinions of the author. They are not a recommendation to buy or sell cryptocurrency and should not be viewed as an endorsement by CoinIdol.com. Readers should do their research before investing in funds.


