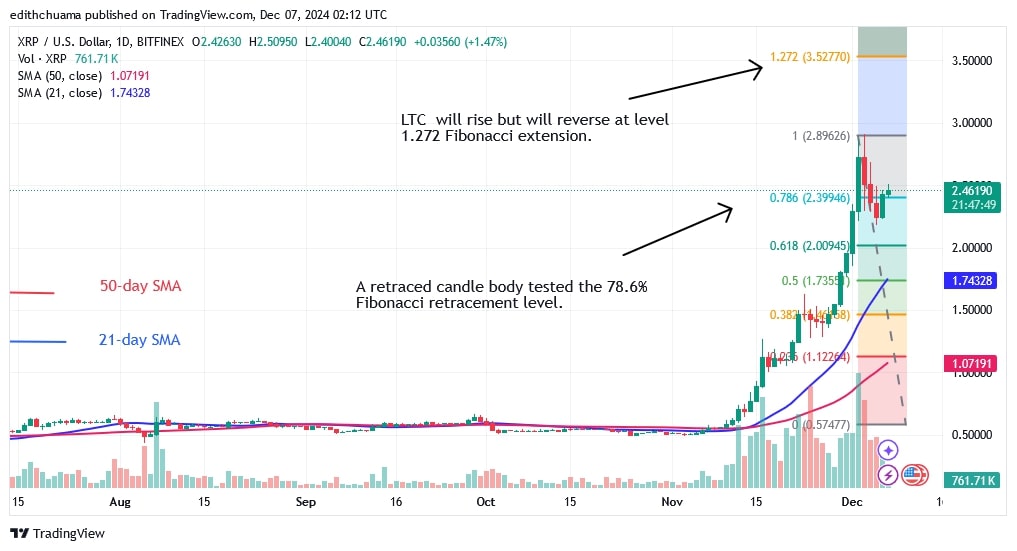
The price of XRP (XRP) has risen significantly after hitting the $3.00 mark on December 2. The altcoin retraced above $2.17, although bulls bought on dips.
XRP long term analysis: bullish
Now, the cryptocurrency has resumed its positive upward momentum. On a positive note, XRP is likely to return to its January 2018 price level, which was $3.30.
The price indicator predicts that the altcoin will rise but then reverse at the 1.272 Fibonacci extension or the high of $3.52.
On the other hand, if XRP falls below the $3.00 resistance level, the altcoin will be forced to move in a range below the previous high but above the moving averages. XRP is now worth $2.43.
XRP indicator analysis
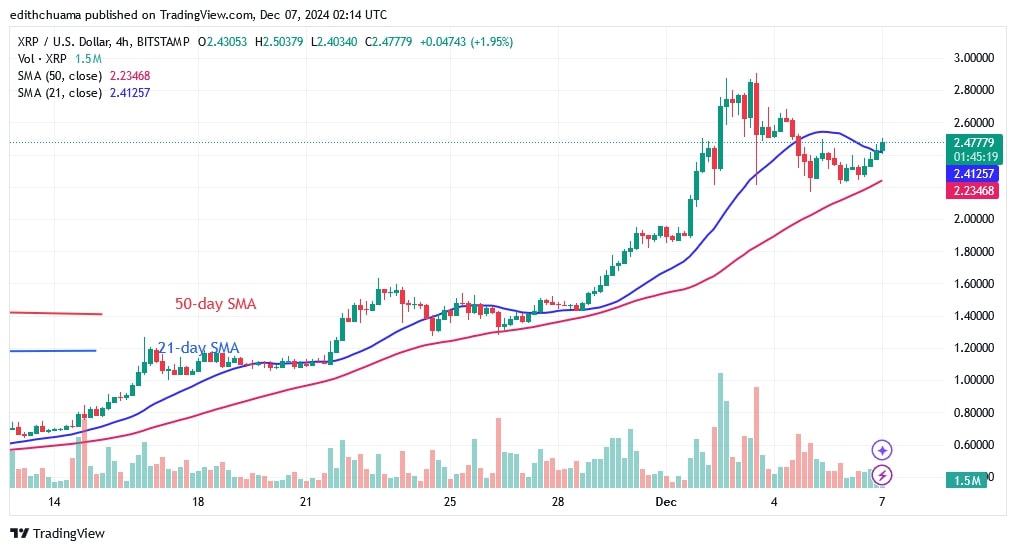
The price bars are still above the moving average lines even though the last high has been rejected. On the 4-hour chart, the price bars were previously trapped between the moving average lines, but are now above them. XRP is expected to move higher after breaking above the 21-day SMA.
Technical indicators:
Resistance Levels – $3.00 and $3.30
Support Levels – $2.00 and $1.70
What is the next direction for XRP?
On the 4-hour chart, XRP is caught between the moving average lines to the downside. The price of the cryptocurrency is rising after rising above the 21-day SMA. The current upward momentum will encounter resistance near the $2.60 high.
However, if the positive momentum continues, the market will reach its previous high of $3.00. In the meantime, the altcoin is oscillating above the $2.20 level and below the $3.00 resistance.

Disclaimer. This analysis and forecast are the personal opinions of the author. They are not a recommendation to buy or sell cryptocurrency and should not be viewed as an endorsement by CoinIdol.com. Readers should do their research before investing in funds.


