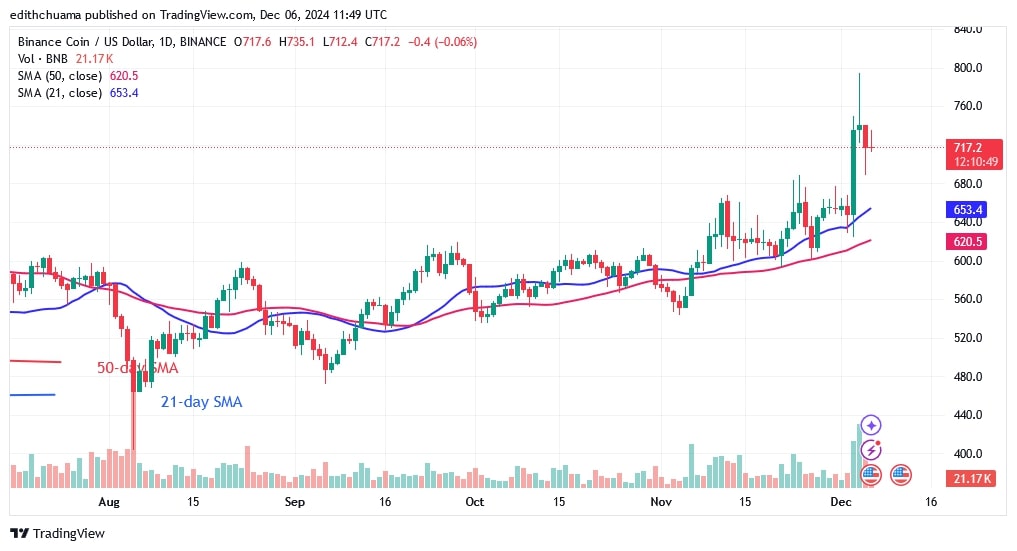
The price of Binance Chain Native Token (BNB) has skyrocketed, breaking above the $724 resistance level.
BNB price long-term forecast: bullish
On December 4, the altcoin reached a high of $794 before being pushed back. Buyers failed to sustain their bullish momentum above the $800 mark. The cryptocurrency fell but eventually recovered above the $720 breakout level. BNB is trading above the moving average lines but below the $760 resistance level. The cryptocurrency is trading above the $720 support level as buyers regroup and resume their uptrend.
On the downside, the positive trend will continue if the buyers hold the $720 support. However, if the bears break the $720 support, BNB will return to its previous range.
BNB indicator reading
On December 4, there was a long candle wick at the $800 resistance level. The long candle represents significant selling pressure at the $800 level. The horizontal moving average lines are moving up. The market is characterised by doji candlesticks which are delaying the price movement.
Technical indicators:
Resistance Levels – $700, $750, $800
Support Levels – $600, $550, $500
What is the next direction for BNB/USD?
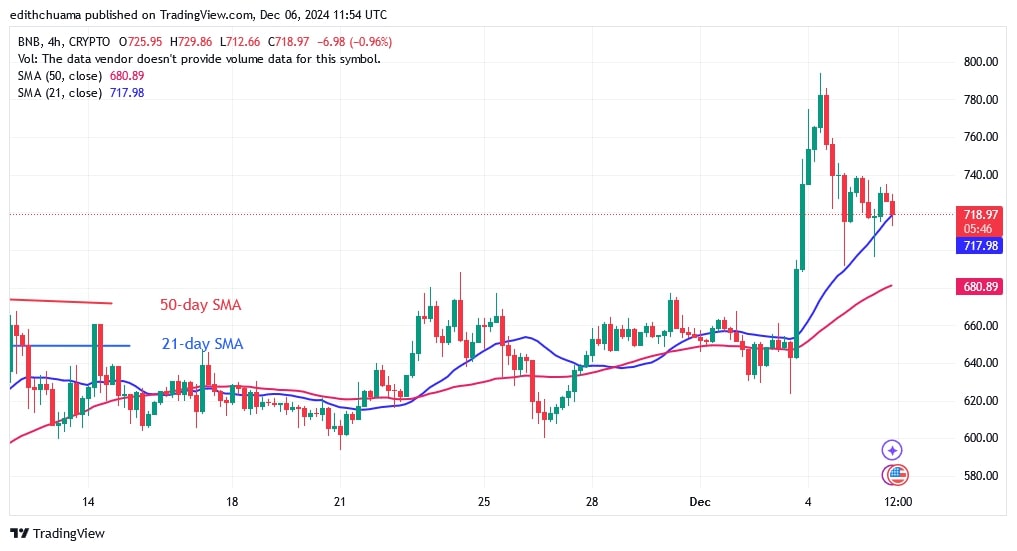
On the 4-hour chart, BNB is above the moving average lines in a downtrend. If the bears break below the 21-day SMA, the decline will continue. BNB will fall above the 50-day SMA or the low of $680. If the crypto price stays above the moving average lines, the upward movement will resume. BNB will reach the previous high of $800 again.

Disclaimer. This analysis and forecast are the personal opinions of the author. They are not a recommendation to buy or sell cryptocurrency and should not be viewed as an endorsement by CoinIdol.com. Readers should do their research before investing in funds.


