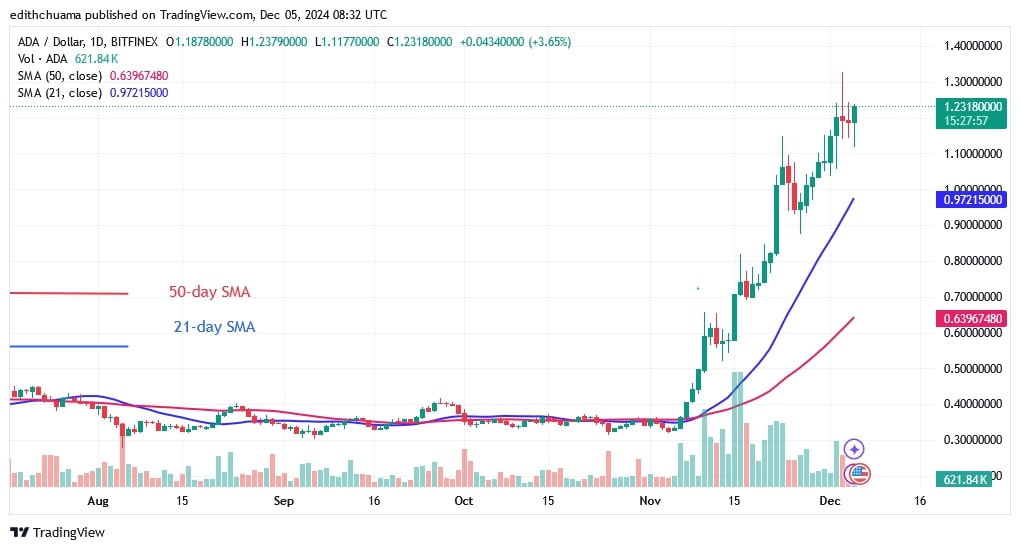
Cardano (ADA) price has risen from the bottom of the chart and has broken above the moving average lines and resistance at $0.76.
Long-term forecast for the Cardano price: bullish
The bullish momentum has paused after reaching a high of $1.18. The resistance at $1.18 is the historical price level from March 21, 2022, as Coinidol.com wrote before.
The resistance level is an overbought area of the market. The bulls have not yet managed to overcome the barrier since 2022. If the buyers overcome the resistance of $1.18, ADA would rise to a high of $1.40 before falling back to its current high. Cardano (ADA) will fall back and range above the moving average lines but below the $1.18 resistance.
ADA indicator analysis
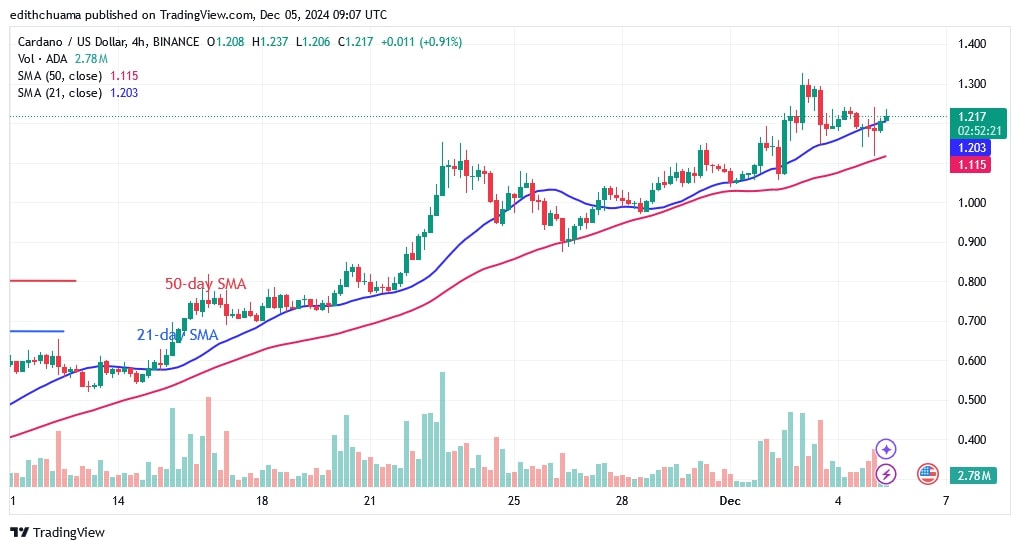
Cardano has reached the overbought zone of the market. On December 3, a long candle wick points to the recent high, signaling significant selling pressure at the recent high. The moving average lines are sloping north, indicating a rise. On the 4-hour chart, the price bars are between the moving average lines, indicating a likely range-bound move.
Technical Indicators
Key Resistance Zones: $1.20, $1.30, and $1.40
Key Support Zones: $0.90, $0.80, and $0.70
What Is the Next Move for Cardano?
On the 4-hour chart, Cardano is in a gentle uptrend and is trading above the moving average lines. The uptrend has stalled below the $1.30 resistance level. The ADA price has slipped below its moving average lines. The altcoin’s bullish trend will begin when it breaks above the 21-day SMA and breaches the resistance at $1.30.

Disclaimer. This analysis and forecast are the personal opinions of the author. They are not a recommendation to buy or sell cryptocurrency and should not be viewed as an endorsement by CoinIdol.com. Readers should do their research before investing in funds.


