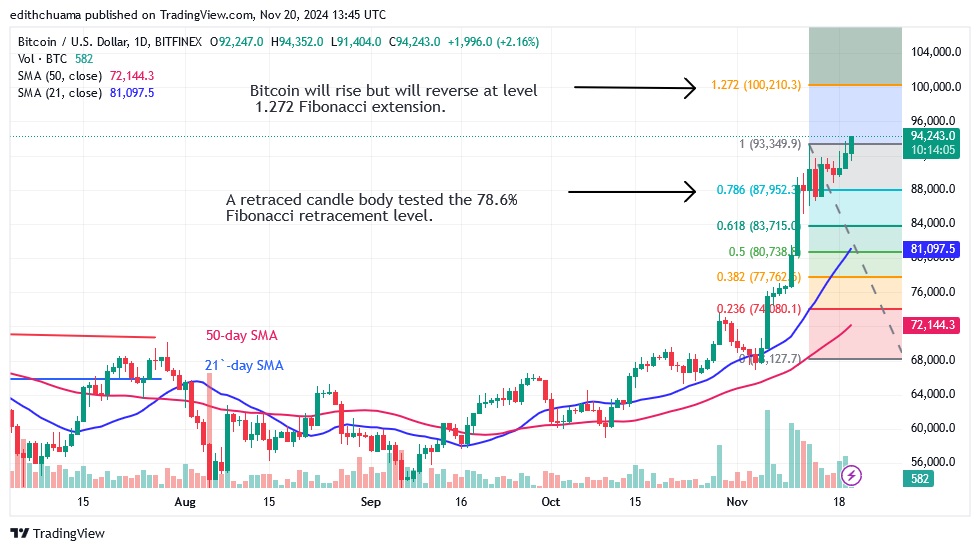
The price of Bitcoin (BTC) has continued its uptrend after rising to $93,318. Cryptocurrency price analysis brought by Coinidol.com.
Bitcoin price long-term forecast: bullish
The largest cryptocurrency has been trading above the $85,000 support but below the $93,000 resistance level. Today, the bulls broke through the resistance at $93,000. According to the price indicator, the cryptocurrency value will reach a high of $100,000. During the uptrend from November 13, a candlestick body approached the 78.6% Fibonacci retracement line. This retracement predicts that Bitcoin will rise but reverse at the 1,272 Fibonacci extension or $100,210. In the meantime, buyers are hoping to break the price barrier of $93,318. Bitcoin will reach its target price once the current barrier is broken.
Bitcoin indicator display
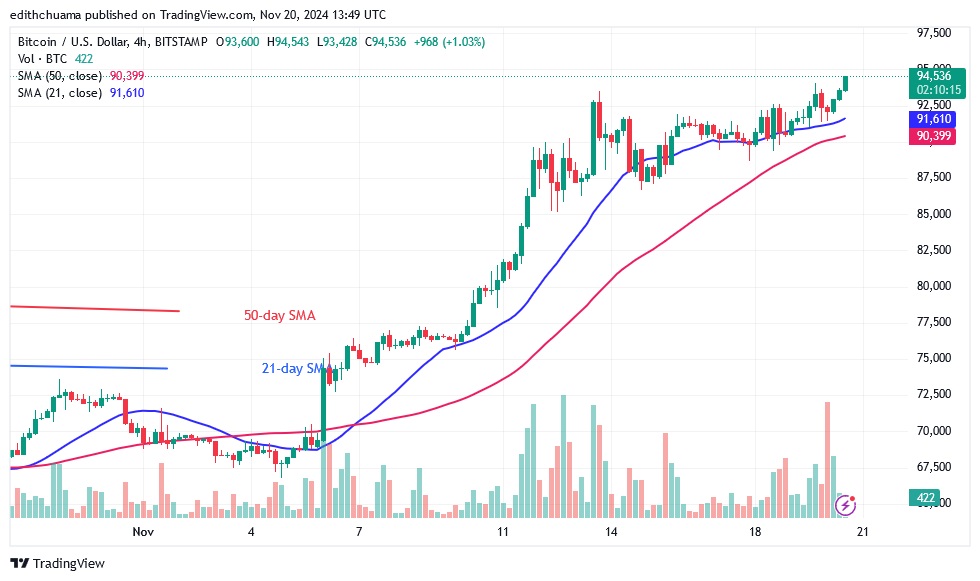
The Bitcoin price is hovering above the support level of $85,000, also known as the 21-day SMA. The moving average lines are still pointing upwards, indicating an uptrend. On the 4-hour chart, the moving average lines are horizontal, indicating a sideways trend. During the market consolidation, doji candlesticks were used to indicate price activity.

Technical indicators:
Key resistance levels – $80,000 and $100,000
Key support levels – $70,000 and $50,000
What is the next direction for BTC/USD?
On the 4-hour chart, Bitcoin price started a sideways trend when it encountered resistance at $93,318. Doji candlesticks are currently slowing down the price movement. Although the cryptocurrency price has breached the current barrier, it is struggling to maintain its positive momentum. The final target for Bitcoin is $100,000.

Disclaimer. This analysis and forecast are the personal opinions of the author. They are not a recommendation to buy or sell cryptocurrency and should not be viewed as an endorsement by CoinIdol.com. Readers should do their research before investing in funds.


