The price of Cardano (ADA) has started an uptrend by breaking through the overhead resistance at $0.40.
Long-term forecast for the Cardano price: bullish
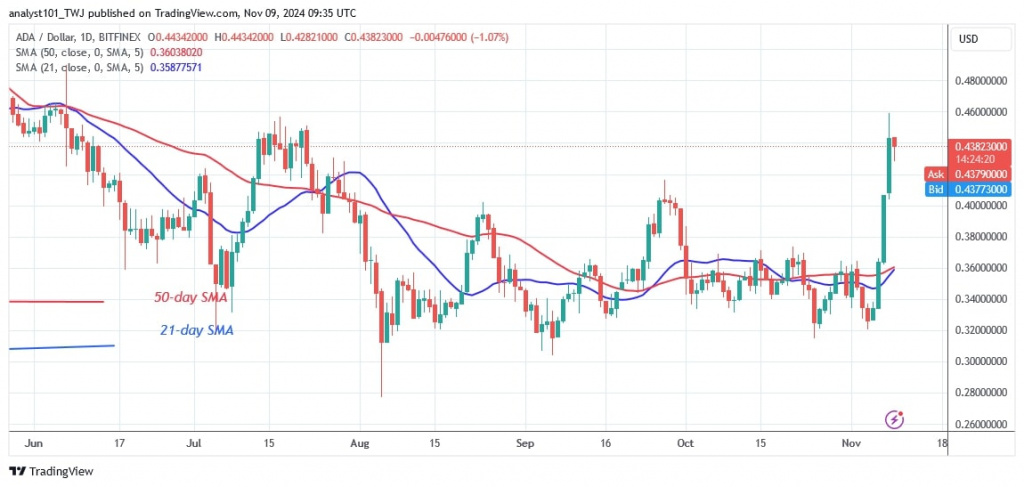
The altcoin has broken out of its current range of $0.30 to $0.40. The altcoin has risen to the next resistance of $0.46. The bulls reached their last peak before coming under selling pressure on July 17, as reported by Coinidol.com. A future uptrend in ADA is unlikely as it fluctuates below its recent high.
However, if the cryptocurrency breaks above the high of $0.46, the ADA price will rise to $0.50. On the other hand, if the altcoin falls from its current high, it will be forced to trade sideways below the recent high but above the breakout level of $0.40. Cardano is currently trading at $0.43.
ADA indicator analysis
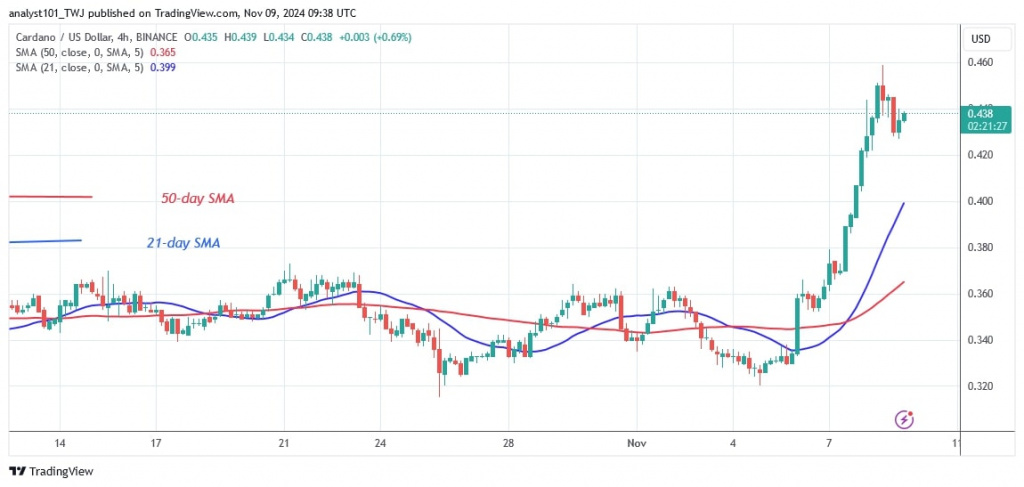
The price bars have pushed well above the moving average lines. On the 4-hour chart, the 21-day SMA has moved well above the 50-day SMA, signaling a bullish crossover and continuation of the rise.
Technical Indicators
Key Resistance Zones: $0.80, $0.85, and $0.90
Key Support Zones: $0.50, $0.45, and $0.40
What Is the Next Move for Cardano?
On the 4-hour chart, Cardano is in an uptrend as it moves above the current price range. The altcoin rose to a high of $0.46 before oscillating back below the recent high but above the $0.43 support. The uptrend will continue if the price breaks above the $0.46 resistance. However, the current trend will be interrupted if the price breaks below the 21-day SMA support.
Disclaimer. This analysis and forecast are the personal opinions of the author. They are not a recommendation to buy or sell cryptocurrency and should not be viewed as an endorsement by CoinIdol.com. Readers should do their research before investing in funds.


