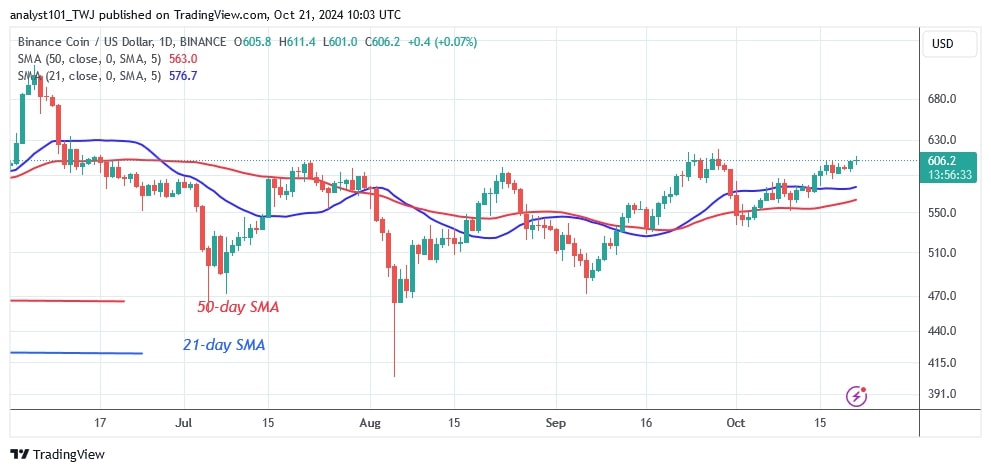
The price of Binance Chain Native Token or BNB (BNB) has risen above the moving average lines and reached the overhead resistance of $600.
Long-term prediction of the BNB price: ranging
The price of the cryptocurrency has retested the overhead resistance for the fifth time. In other words, buyers have failed to keep the price above the $600 peak since July 21. Now, if buyers manage to break above the $600 level, the market will reach a high of $724.
However, BNB will fall if it goes down from the recent high. The cryptocurrency value will return to its previous range between $480 and $600. The current price of BNB is $608.80.
BNB indicator reading
BNB’s price bars have risen above the moving average lines since the breakout on October 14. The moving average lines are horizontal and indicate a sideways trend. There are extended candlestick wicks pointing towards the resistance zone. Long candlestick wicks indicate significant selling pressure on rising prices.
Technical indicators:
Resistance Levels – $600, $650, $700
Support Levels – $400, $350, $300

What’s next for BNB/USD?
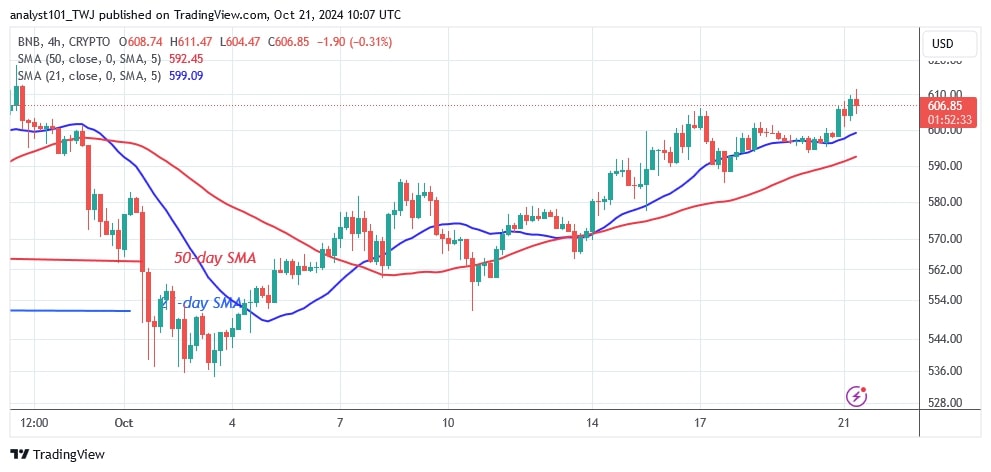
The 4-hour chart shows that BNB is in an uptrend after the price drop on October 3, as reported by Coinidol.com before. The price of the cryptocurrency has risen to $610, but is still being rejected. The altcoin is moving back above the moving average lines, i.e. the $600 support. If BNB falls below the $600 level, the selling pressure will increase again and BNB will fall and continue its range-bound movement.
Disclaimer. This analysis and forecast are the personal opinions of the author. They are not a recommendation to buy or sell cryptocurrency and should not be viewed as an endorsement by CoinIdol.com. Readers should do their research before investing in funds.


