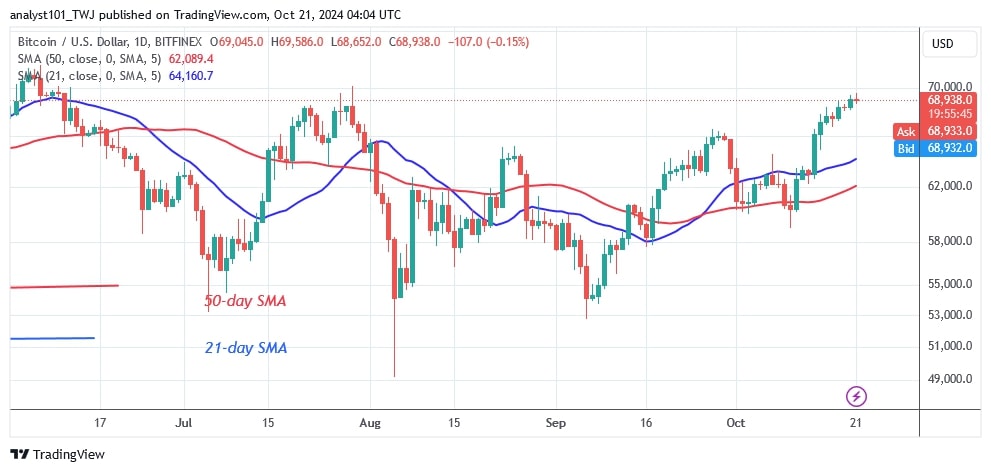
The Bitcoin (BTC) price peaked at $69,402 on October 20. The upward momentum was rejected at the psychological price barrier of $70,000.
Bitcoin price long-term forecast: bullish
The cryptocurrency price has retraced above the $68,000 support and continues to fluctuate below the recent high. In the last 24 hours, the BTC price has fluctuated above the $68,000 support and below the $70,000 peak. The largest cryptocurrency encounters resistance when it reaches its high of $70,000. If the bulls break above $70,000, Bitcoin will reach its previous highs of $72,000 and $73,588 respectively.
If Bitcoin falls below $68,000, selling pressure will increase. The cryptocurrency value will first fall above the breakout level of $65,000. Bitcoin is currently worth $67,321.
BTC indicator reading
The price bars remain above the moving average lines, but Bitcoin is trading modestly due to the appearance of doji candlesticks. The cryptocurrency value is approaching the overbought area as selling takes place. Doji candlesticks indicate traders’ hesitation about the market direction. Moving average lines are sloping north, indicating a rise.
Technical indicators:
Resistance Levels – $70,000 and $80,000
Support Levels – $50,000 and $40,000
What is the next direction for BTC/USD?
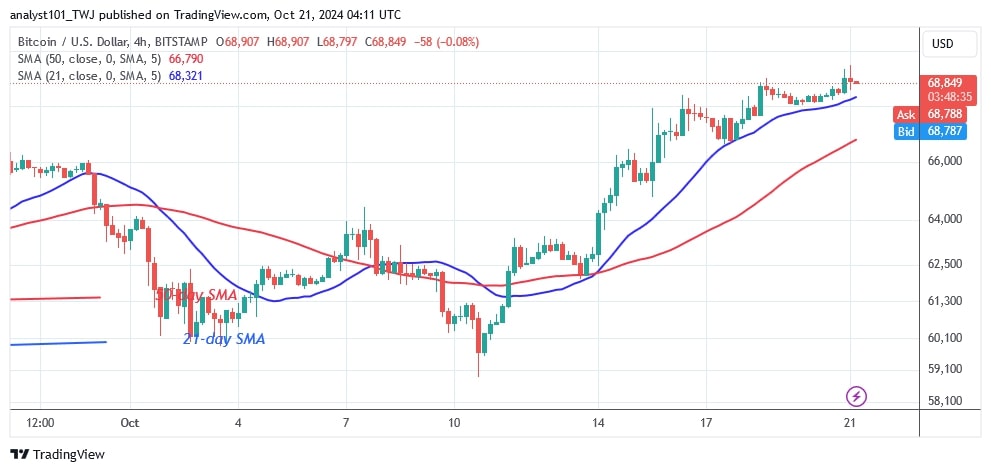
The 4-hour chart shows that Bitcoin is in an uptrend and approaching the high of $70,000. As reported by Coinidol.com, on October 18, the bullish momentum encountered resistance at $68,998 before recovering above the 21-day SMA.
Today, bullish momentum is also being rejected as it encounters resistance at $69,487. Bitcoin price is stabilizing above the 21-day moving average line but is fluctuating below $70,000. Bitcoin is expected to break out or fall in the near future.
Disclaimer. This analysis and forecast are the personal opinions of the author. They are not a recommendation to buy or sell cryptocurrency and should not be viewed as an endorsement by CoinIdol.com. Readers should do their research before investing in funds.


