The price of Solana (SOL) has settled below the upper resistance of $160. Price analysis by Coinidol.com.
Long-term outlook for Solana price: bullish
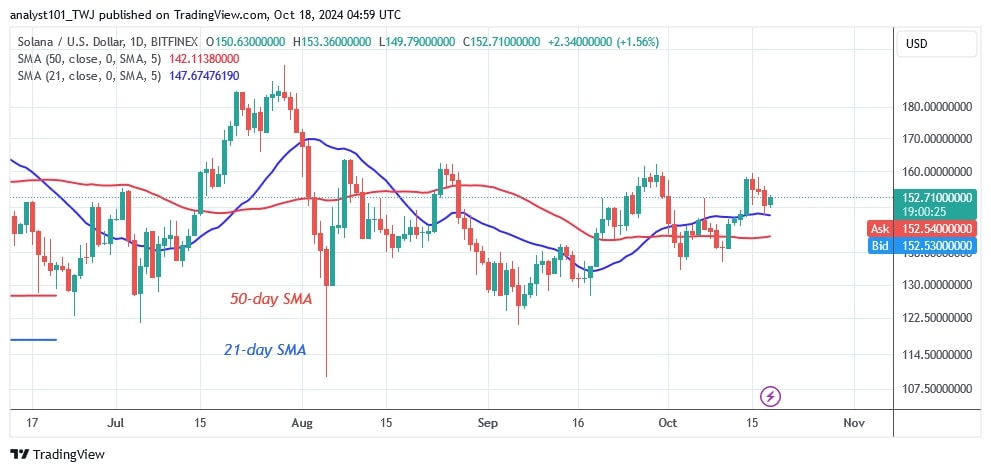
As previously reported by Coinidol.com, the cryptocurrency has approached the above resistance four times since August 8, but has been unable to overcome it. The market will either rise above the lower price range of $130 or fall below the moving average lines with each price change. In other words, Solana has been trading in the $130 to $160 range.
Today, SOL has retraced above the 21-day SMA support and resumed its uptrend. If buyers break above the $160 resistance, the market will return to its previous highs of $185 and $194. If the bullish theory proves wrong, Solana will continue to trade sideways between $130 and $160. In the meantime, the altcoin price is $152.
SOL price indicator analysis
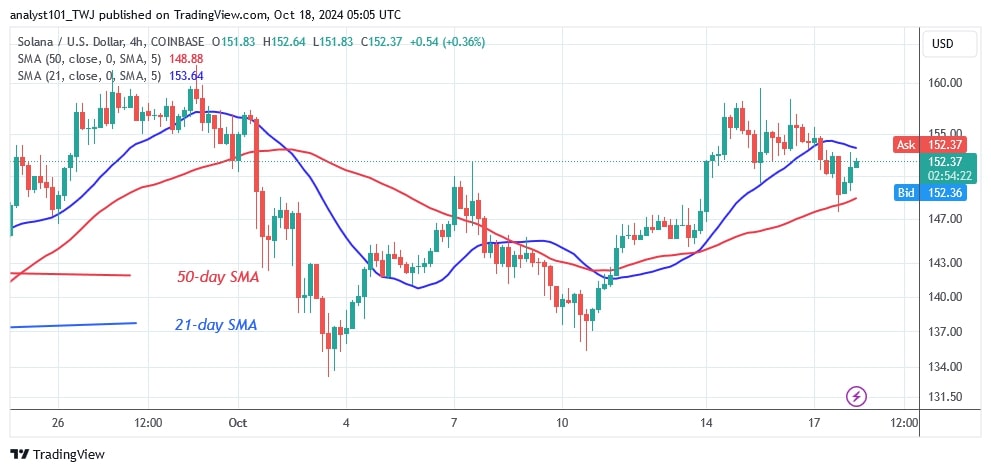
On the daily chart, the price of the cryptocurrency is above the moving average lines, indicating that it will continue to rise. The moving average lines are horizontal, with a bullish crossover. On the 4-hour chart, the price bars are between the moving average lines, indicating a sideways movement of the coin.
Technical indicators
Key supply zones: $200, $220, $240
Key demand zones: $120, $100, $80
What is the next move for Solana?
On the 4-hour chart, Solana is correcting upwards while trading sideways. The upward correction has ended as the cryptocurrency dips below the 21-day SMA. However, the cryptocurrency is trapped between the moving average lines. The value of the altcoin will rise or fall if the moving average lines are broken.

Disclaimer. This analysis and forecast are the personal opinions of the author. They are not a recommendation to buy or sell cryptocurrency and should not be viewed as an endorsement by CoinIdol.com. Readers should do their research before investing in funds.


