The price of Solana (SOL) is bearish as it continues its sideways pattern.
Long-term Solana price prediction: ranging
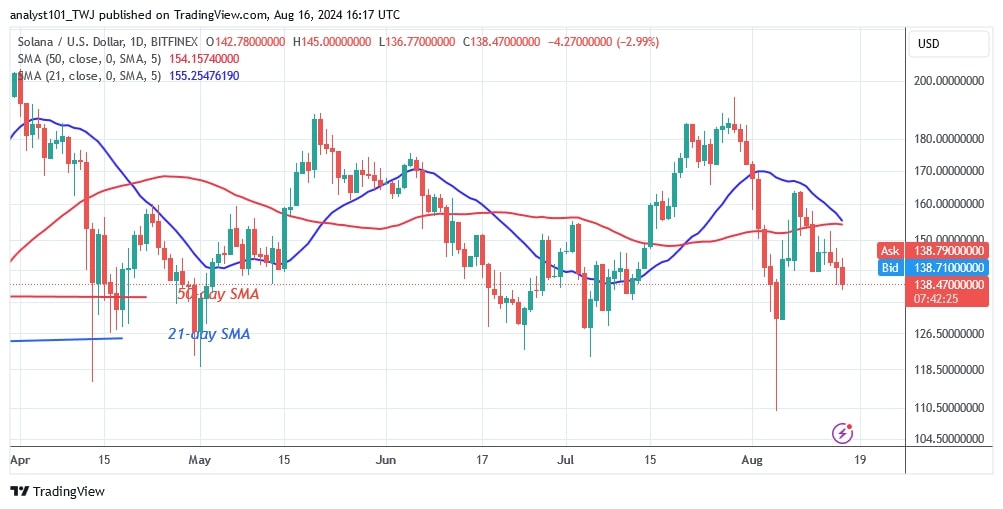
On August 8, the cryptocurrency was trapped between two moving average lines before its recent decline, as Coinidol.com wrote. Buyers were unable to sustain the bullish momentum above the 21-day SMA, leading to a decline.
On the downside, the range-bound move will continue if the altcoin retraces and finds support above $126. Previously, the price of the altcoin ranged between $126 and $190. Meanwhile, if the current support holds, SOL will trade above the $126 support but below the moving average lines. Solana is now valued at $139.
Analysis of the Solana price indicator
The price bars are now below the moving average lines, having previously been trapped between them. Doji candlesticks dominate the price action and slow down its movement. The price of Solana is trading marginally and is approaching the low of $126.
Technical indicators
Major supply zones: $200, $220, $240
Major demand zones: $120, $100, $80
What is the next move for Solana?
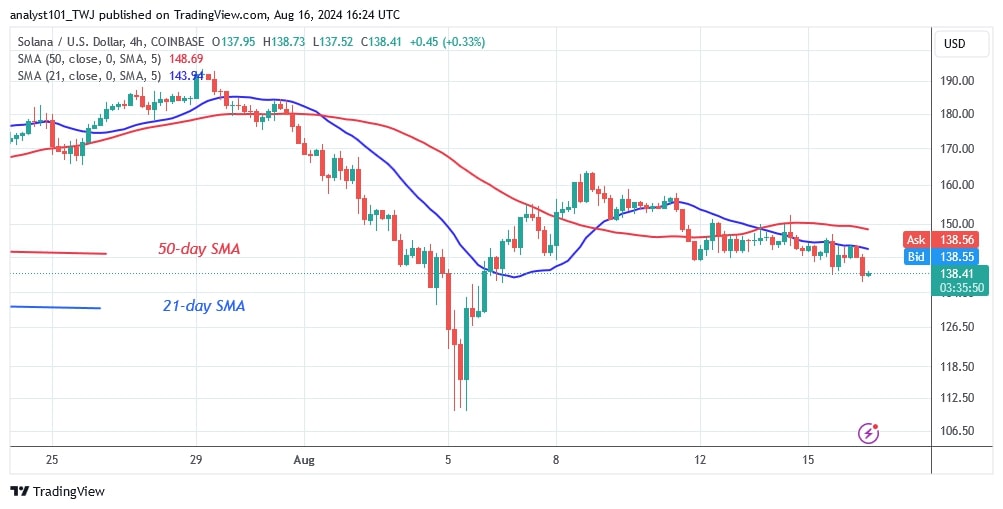
The price of Solana continues to trend sideways, holding above the support level of $140. On the 4-hour chart, the price is trading within a narrow range between $130 and $150. The Doji candlesticks have ensured that the price movement is immobile. The altcoin will remain stable for a few more days.

Disclaimer. This analysis and forecast are the personal opinions of the author. They are not a recommendation to buy or sell cryptocurrency and should not be viewed as an endorsement by CoinIdol.com. Readers should do their research before investing in funds.


