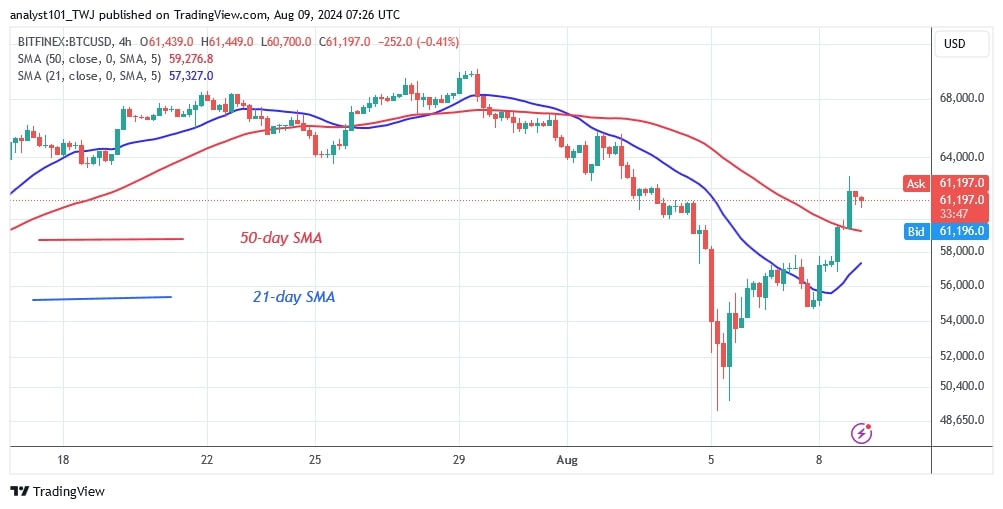
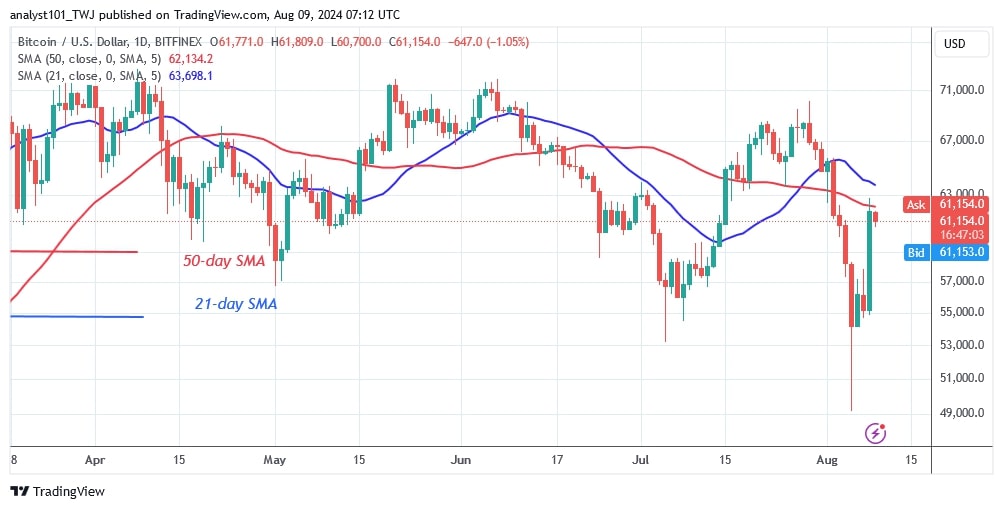
The price of Bitcoin (BTC) has recovered after hitting a low of $49,130 on August 5. The largest cryptocurrency fell into oversold territory as bulls bought dips.
Long-term forecast for the Bitcoin price: bearish
Today, August 9, the BTC price corrected upwards after hitting the $63,000 mark. The uptrend was halted by the 50-day SMA. Traders are selling amid the recent rallies. Bitcoin will test its current support as it begins its range-bound move.
The cryptocurrency is currently in a rangebound move between the $53,000 support and the moving average lines. The rangebound movement may continue for a few more days. BTC is currently worth $59,836.
BTC indicator reading
Bitcoin price is still below the moving average lines despite its recent uptrend. However, on the 4-hour chart, the price bars are above the moving average lines. Bitcoin is rising as it is above the moving average lines.
Technical indicators:
Key resistance levels – $70,000 and $80,000
Key support levels – $50,000 and $40,000
What is the next direction for BTC/USD?
Selling pressure has eased as Bitcoin has moved higher. Bitcoin’s uptrend has been broken and the price has started to meander sideways. The Bitcoin price is currently fluctuating between $53,000 and $63,000.
On the upside, Bitcoin will resume its positive momentum if it breaks above the moving average lines.
However, Bitcoin is still in a downtrend. A break of the $49,000 support level will send Bitcoin to a low of $42,000.

On August 5 Coinidol.com reported that the price of Bitcoin has dropped significantly as the largest cryptocurrency lingered above the psychological price level of $50,000.
Disclaimer. This analysis and forecast are the personal opinions of the author. They are not a recommendation to buy or sell cryptocurrency and should not be viewed as an endorsement by CoinIdol.com. Readers should do their research before investing in funds.


