The price of Ripple (XRP) is currently trading below the moving average lines, although it is correcting upwards. Ripple coin price analysis by Coinidol.com.
XRP long-term analysis: bearish
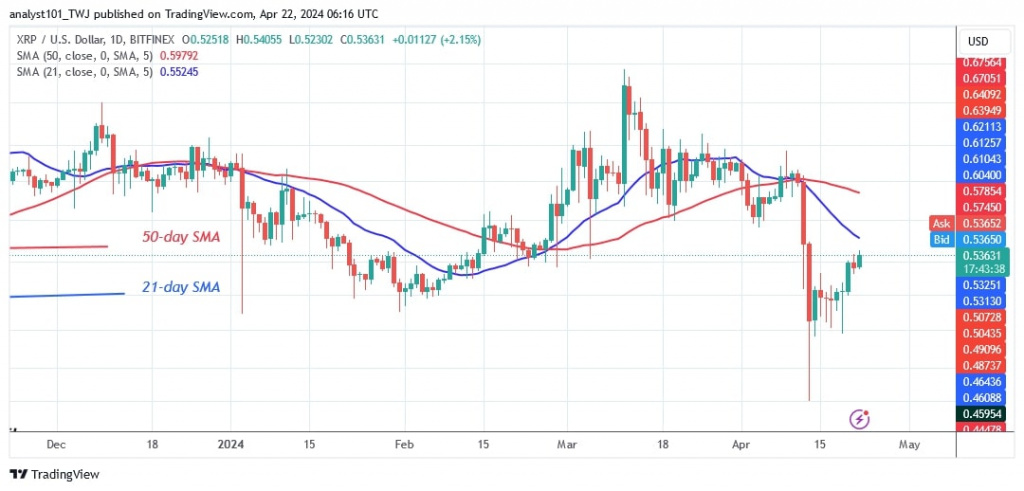
The bulls bought the decline at a low of $0.41. They halted the decline above the support level of $0.46 and resumed the uptrend. The price of the cryptocurrency is approaching the 21-day SMA or resistance at $0.55. The altcoin will rise to its 50-day SMA high or $0.60 if the buyers break the barrier at the 21-day SMA. If the buyers sustain the price above the 50-day SMA, the cryptocurrency will rally to its previous high of $0.74.
However, if the bullish momentum fails to overcome the current resistance level, the current price range of $0.46 and the 21-day SMA will remain. XRP/USD is worth $0.53 at the time of writing.
XRP indicator analysis
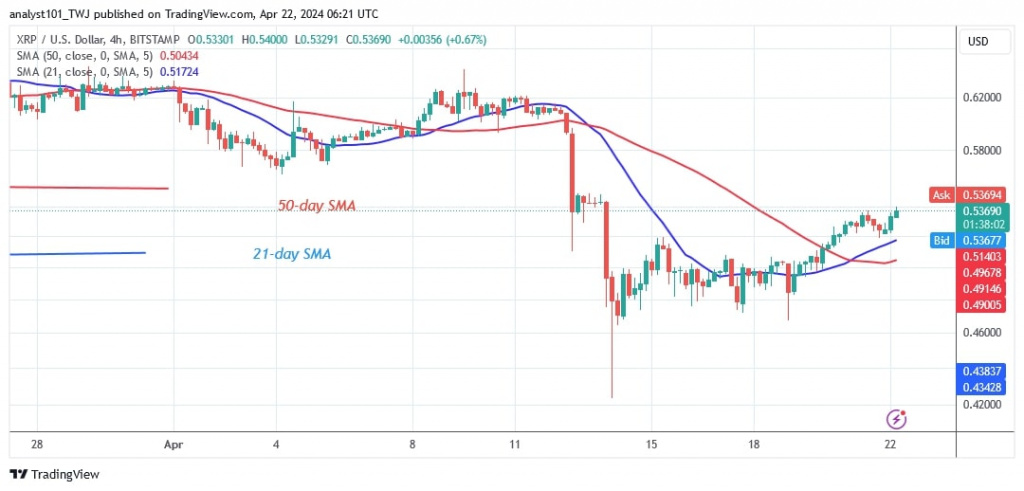
On the 4-hour chart, XRP price bars are above the moving average lines as the altcoin resumes its uptrend. The uptrend could be rejected at the moving average lines. Though, the current price rise has led to a bullish crossover between the moving average lines. The cryptocurrency has a bullish signal that allows traders to place a buy order.
Technical indicators:
Key resistance levels – $0.80 and $1.00
Key support levels – $0.40 and $0.20
What is the next direction for XRP?
On the 4-hour chart, the altcoin is trading sideways and consolidating above the $0.46 support in anticipation of a positive trend. The upward movement hits a first resistance at $0.54. The cryptocurrency will start a rise between $0.46 and $0.54 where it faces rejection at the previous high.

Coinidol.com reported on April 14, when Ripple reached a bearish exhaustion after falling to a low of $0.41 before recovering.
Disclaimer. This analysis and forecast are the personal opinions of the author and are not a recommendation to buy or sell cryptocurrency and should not be viewed as an endorsement by CoinIdol.com. Readers should do their research before investing in funds.


