Litecoin (LTC) price is still trading below the moving average lines but remains above the $65 support. Price analysis by Coinidol.com.
Long-term forecast for the Litecoin price: fluctuation
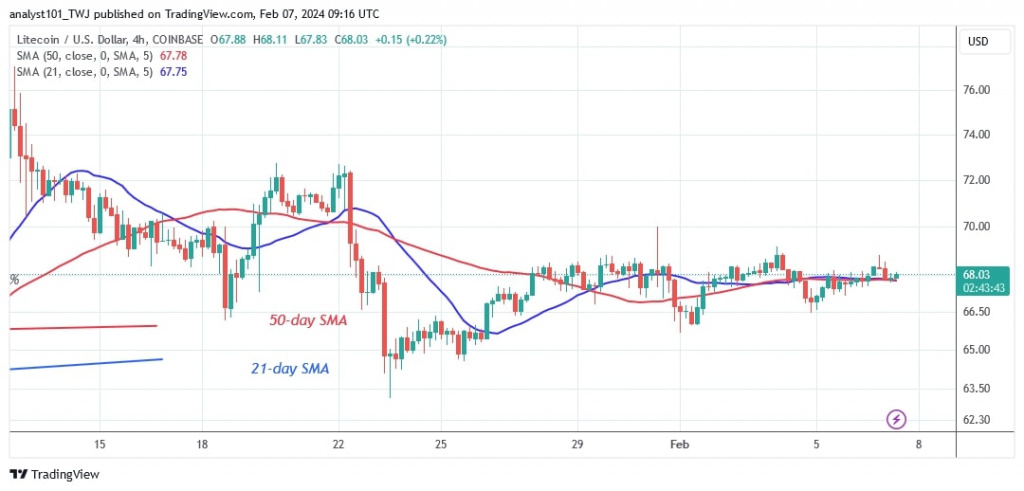
Since January 23, 2024, the altcoin’s price movement has remained constant, hovering between $60 and $70. Nonetheless, the presence and dominance of doji candlesticks has forced the price movement to remain stable. At the time of writing, the altcoin is worth $68.
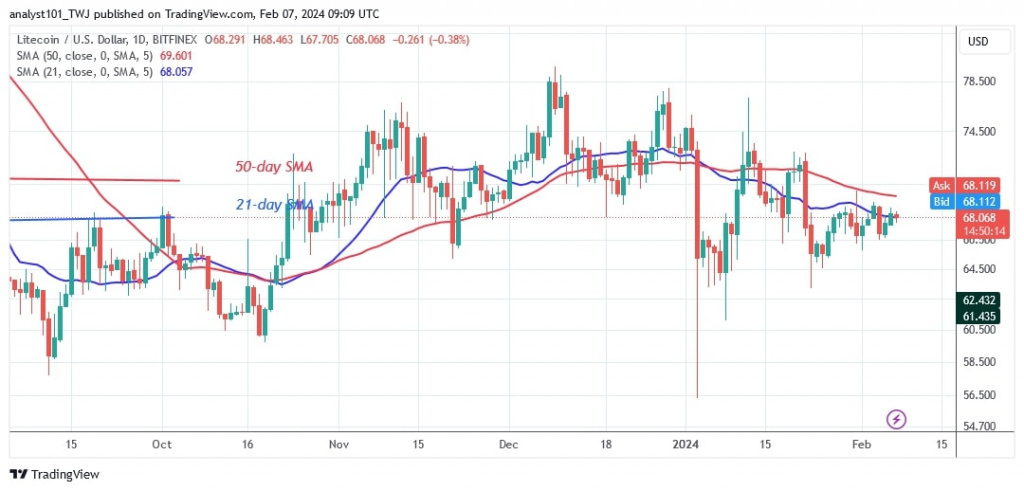
On the upside, Litecoin has been repelled three times as buyers try to keep the price above the moving average lines. Currently, the price is stuck at the 21-day SMA but above the $65 support. Litecoin will rise above the moving average lines if it breaks out of its current support level. The positive momentum will continue to the previous high of $76. On the downside, the altcoin will fall if it loses the $65 support. The altcoin will fall to its previous low of $60.
Analysis of Litecoin indicators
The LTC price bars have retraced back below the moving average lines after rejecting the 21-day SMA thrice. The price bars have hit the resistance of the 21-day SMA. The appearance of several doji candlesticks has caused the Litecoin price to stagnate.
Technical indicators
Resistance levels: $100, $120, $140
Support levels: $60, $40, $20
What’s the next move for Litecoin
The digital asset is currently trading in the lower price range of $60 to $70. The altcoin is solidly supported above the $65 price point but is trading below the moving average lines. Litecoin will fall much further if it breaks the $65 support level.

Disclaimer. This analysis and forecast are the personal opinions of the author and are not a recommendation to buy or sell cryptocurrency and should not be viewed as an endorsement by CoinIdol.com. Readers should do their research before investing in funds.


