Analysis of the Binance (BNB) coin price by Coinidol.com. BNB is trading at $254.
Binance coin price long term prediction: bullish
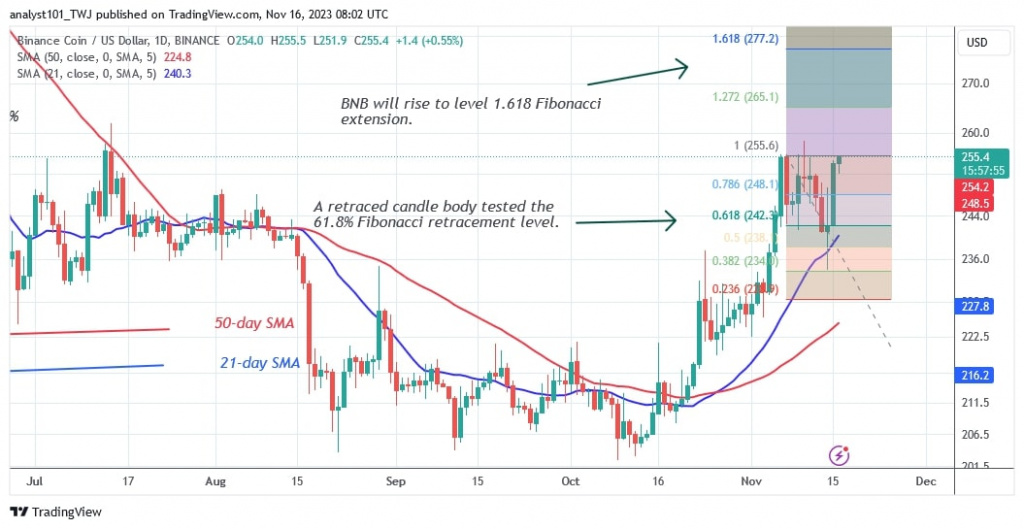
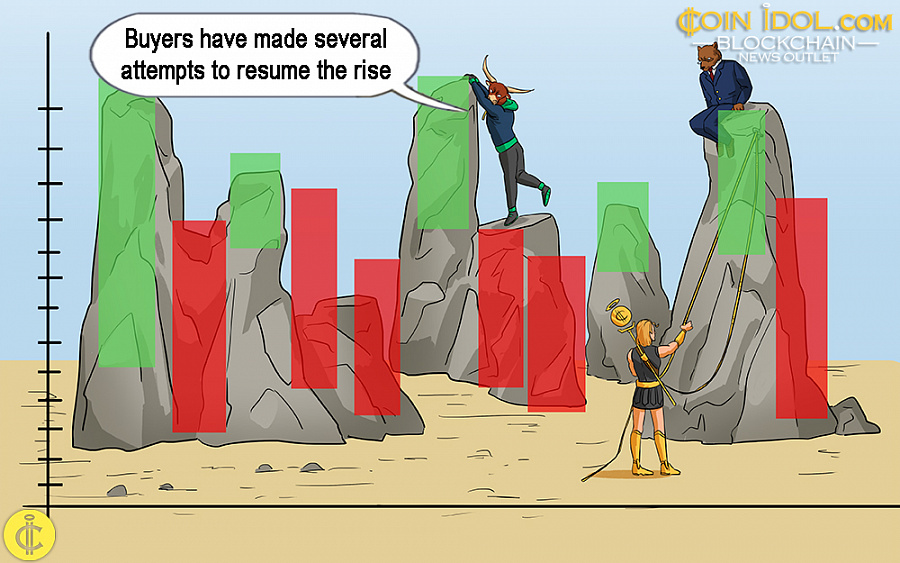
The price of Binance coin has entered a sideways trend after the uptrend ended on November 6. Due to the barrier at $256, buyers have made four unsuccessful attempts to resume the current rise.
The bulls are currently retesting the resistance level in order to break through it. If the bulls prevail, the market will rise to a high of $280. If the bullish scenario is broken, BNB will remain in its current price range. The cryptocurrency will trade between $242 and $256. If the range is broken, BNB will go long.
BNB indicator reading
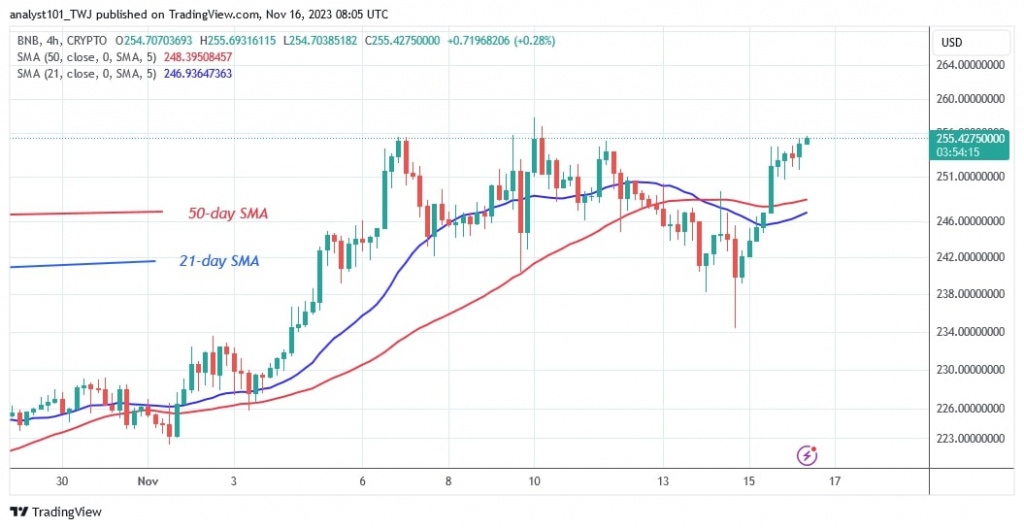
On November 14, BNB fell sharply but recovered and traded above the 21-day SMA. The tail of the long candle is below the 21-day simple moving average, indicating strong buying at lower price levels. The price bars have returned above the moving average lines, indicating an impending uptrend.
Technical indicators:
Key resistance levels – $300, $350, $400
Key support levels – $200, $150, $100

What is the next direction for BNB/USD?
This is the fourth rejection of the current high, so it seems doubtful that BNB will rise above $256 again. The altcoin’s downtrend is likely to continue as long as it remains above the moving average lines.
After rejecting the recent high, the altcoin is backtracking. The price fluctuations in BNB will continue.
Coinidol.com reported on November 9 that BNB/USD was moving between $235 and $255.

Disclaimer. This analysis and forecast are the personal opinions of the author and are not a recommendation to buy or sell cryptocurrency and should not be viewed as an endorsement by CoinIdol.com. Readers should do their research before investing in funds.


