


After a decisive breakout above the 100 and 200-day moving averages last week, the price retraced and formed a pullback to confirm the breakout, restoring confidence.
The market exhibits a robust bullish momentum, targeting the critical $31K region.
Technical Analysis
By Shayan
The Daily Chart
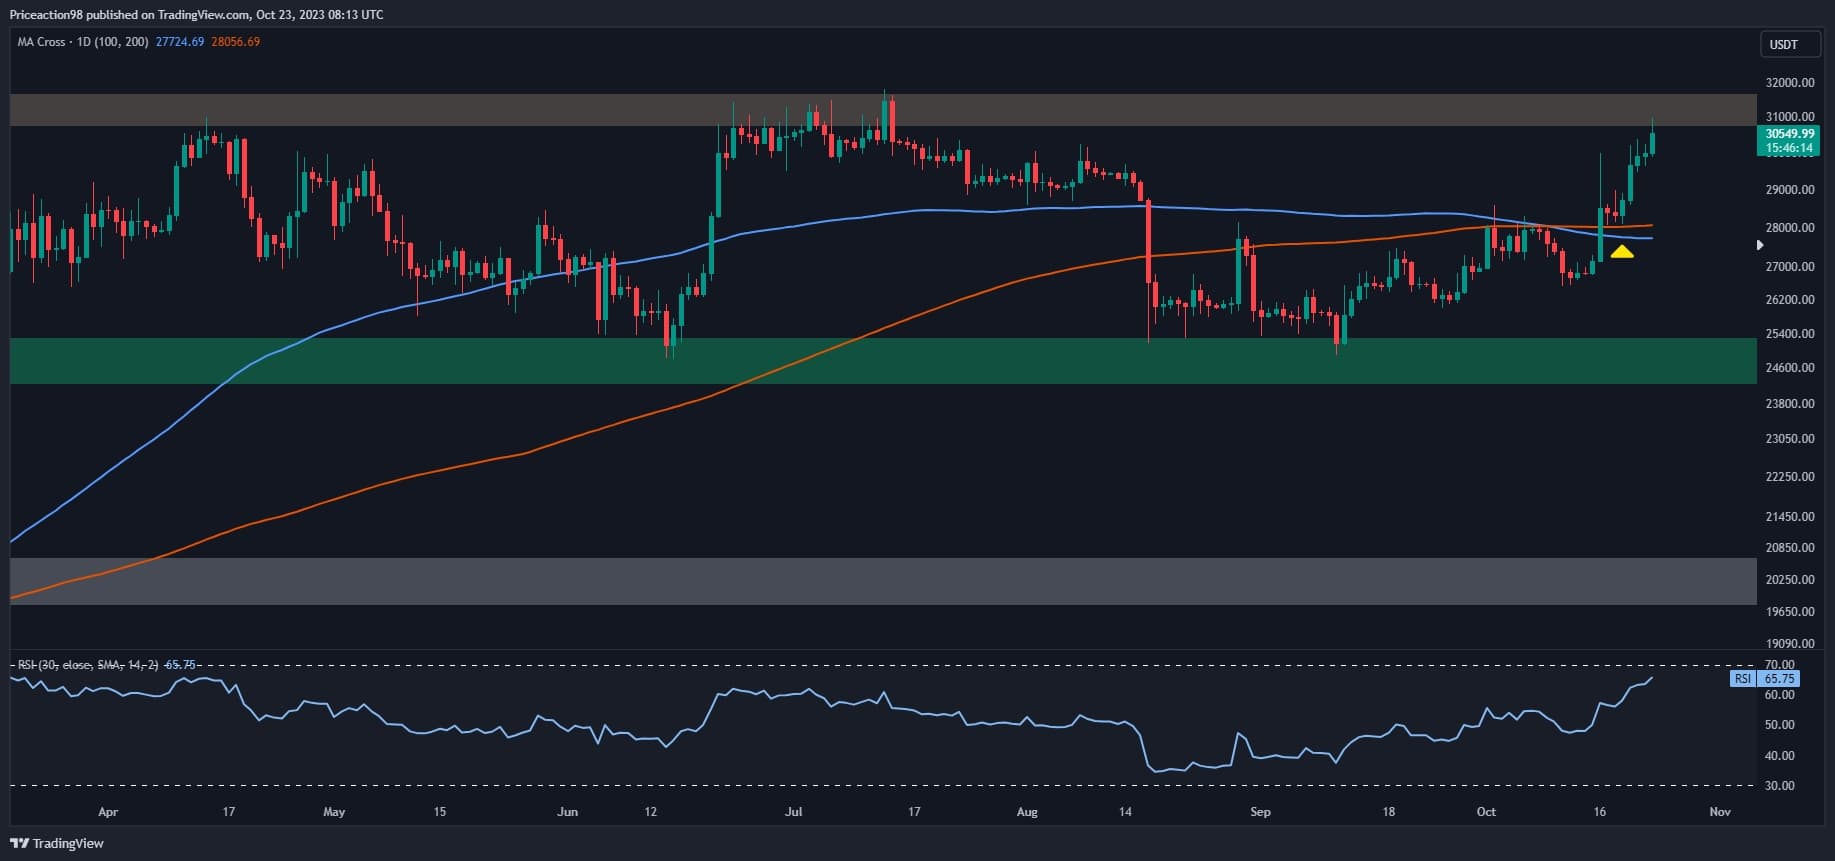
Looking at the daily chart, the price demonstrated an impulsive surge, surpassing the vital resistance zone around the $27K mark marked by the 100 and 200-day moving averages. However, as is customary, every breakout is followed by a pullback for confirmation.
Accordingly, the price returned to the moving averages, completing a pullback and gaining momentum, driving Bitcoin towards the significant resistance area of $31K, which also aligns with the cryptocurrency’s yearly high.
It is worth noting that this price range serves as a substantial psychological barrier. Hence, if buyers successfully reclaim this essential level, the market could pave the way for a mid-term bullish trend, targeting higher resistance zones.
Conversely, in the event of a rejection, Bitcoin may enter a period of consolidation correction marked by increased volatility.

The 4-Hour Chart
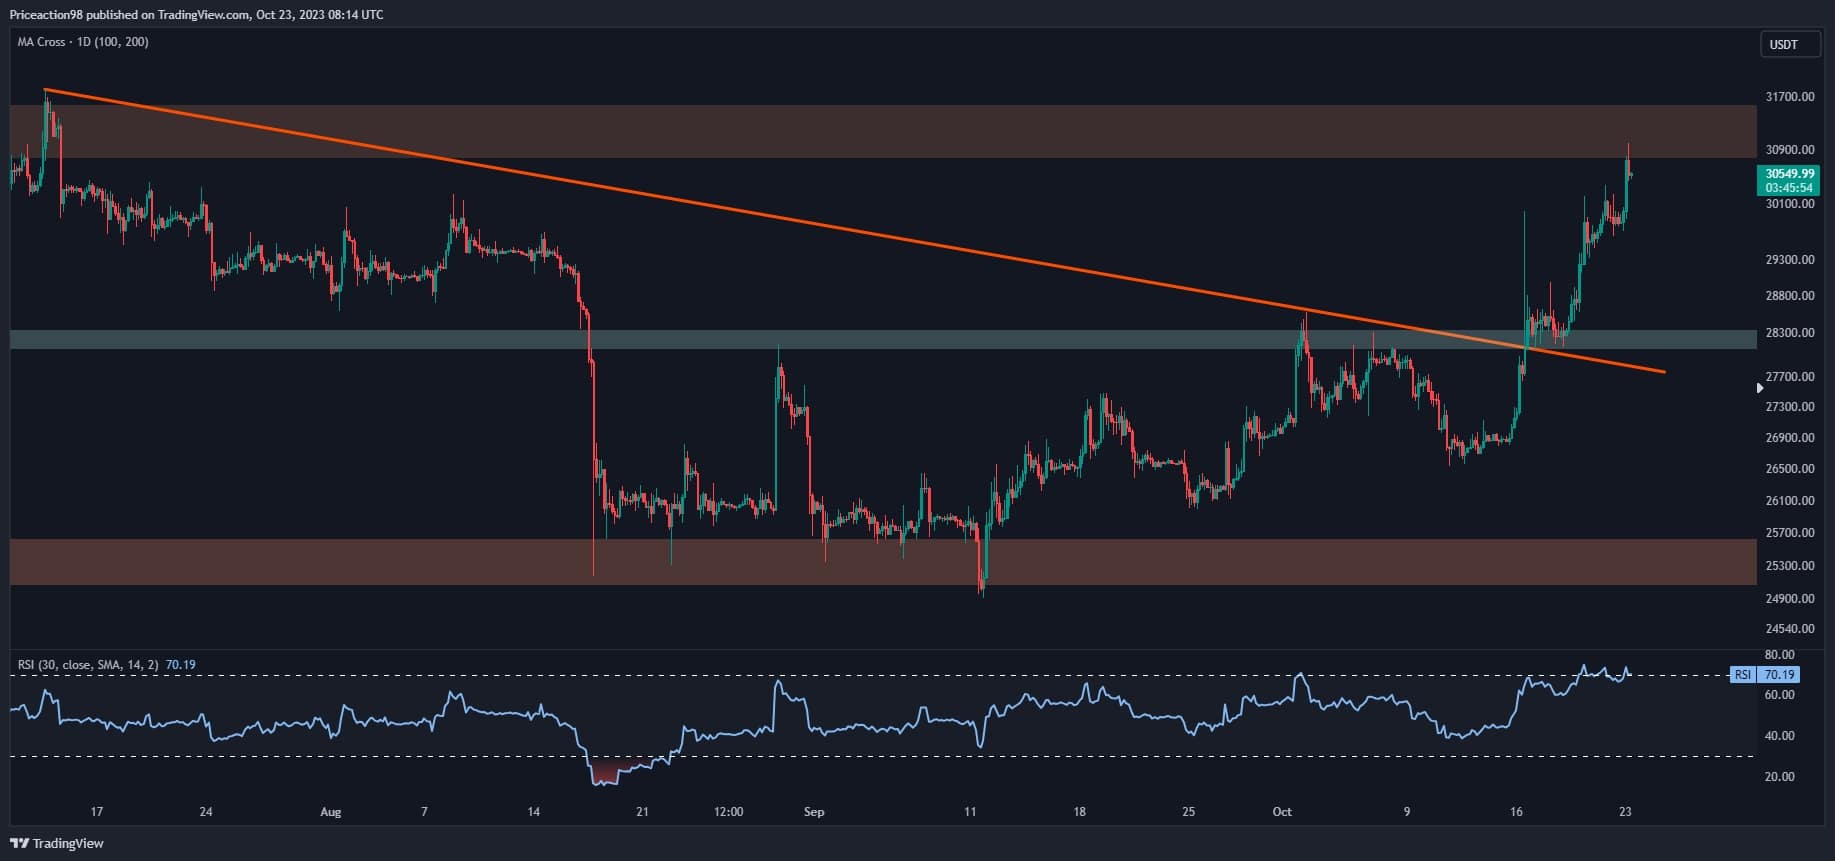
On the 4-hour chart, a noticeable bullish divergence between the price and the RSI indicator, coupled with prevailing demand around the $25K mark, led to a robust upward movement surpassing the multi-month descending trendline. However, the resistance zone at the $30K mark is characterized by significant Bitcoin supply, which might temporarily impede the uptrend, potentially triggering a correction.
Nonetheless, if buyers manage to overpower sellers, a sudden breakout could occur, potentially leading to the liquidation of numerous short positions.
Regardless of the outcome, closely monitoring price action in the coming days is imperative for making informed trading decisions, given the expected mid-term volatility that will significantly influence the market’s direction.
On-chain Analysis
By Shayan
The futures market has played a significant role in shaping Bitcoin’s recent price movements. Therefore, the futures market must remain favorable for the current uptrend to persist.
The chart below illustrates the 30-day moving average of the Bitcoin Taker Buy-Sell ratio, a vital metric for evaluating sentiment in the futures market. This metric helps determine whether buyers or sellers are executing more aggressive orders.
The chart shows that the taker buy-sell ratio has been steadily increasing, surpassing 1, indicating a prevailing bullish sentiment in the futures market. This uptrend aligns perfectly with Bitcoin’s recent impulsive surge, pushing toward the $30K resistance level.
If this metric continues trending above 1, a bullish continuation in the short term can be anticipated. However, if the ratio fails to maintain this momentum, any bullish momentum may be unsustainable, potentially leading to increased market volatility.

Binance Free $100 (Exclusive): Use this link to register and receive $100 free and 10% off fees on Binance Futures first month (terms).
PrimeXBT Special Offer: Use this link to register & enter CRYPTOPOTATO50 code to receive up to $7,000 on your deposits.
Disclaimer: Information found on CryptoPotato is those of writers quoted. It does not represent the opinions of CryptoPotato on whether to buy, sell, or hold any investments. You are advised to conduct your own research before making any investment decisions. Use provided information at your own risk. See Disclaimer for more information.
Cryptocurrency charts by TradingView.


")
