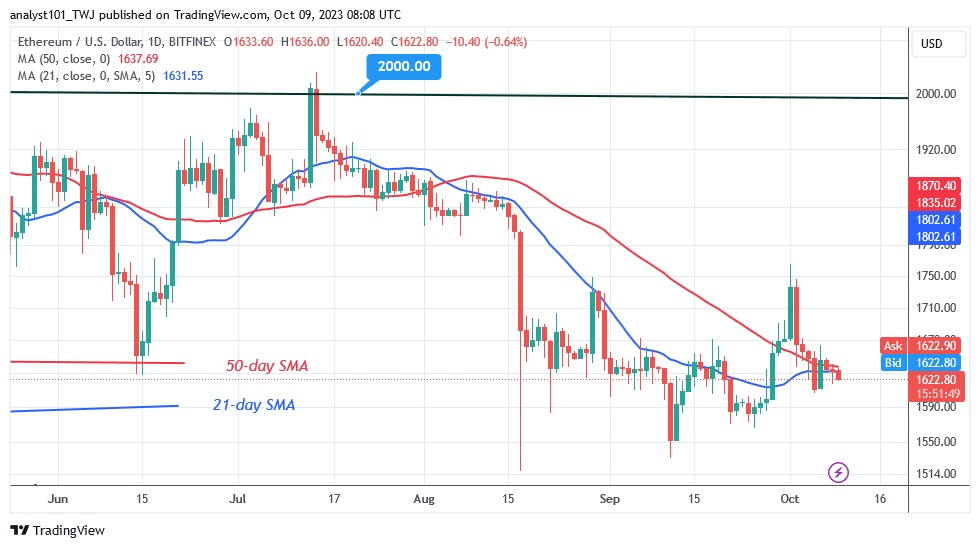
Cryptocurrency analysts of Coinidol.com report, the Ethereum (ETH) price, which experienced rejection at the high of $1,765, has fallen below the moving average lines.
Long-term analysis of the Ethereum price: bearish
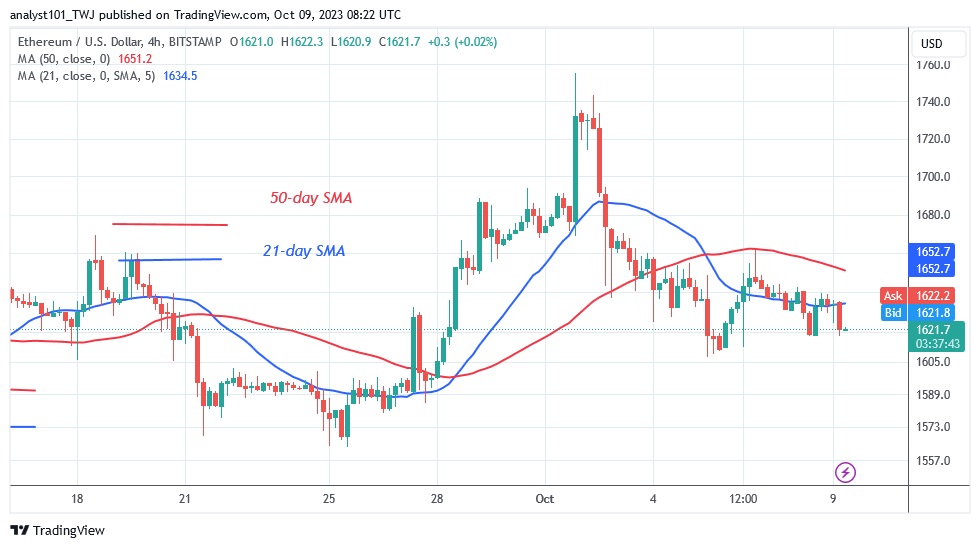
Ether has returned to its previous price range of $1,600 to $1,740. If the bears break below the $1,600 support level, the market will fall and retest the previous low at either $1,570 or $1,532.
In the recent price action, the crucial support was violated three times as Ether found support above $1,500. Meanwhile, the altcoin is moving in the downtrend zone above the current support at $1,600.
Ethereum indicator analysis
The bears have broken below the moving average lines while the price bars are entering the negative trend zone. The moving average lines have been trending down since the price decline on August 17. The descending moving average lines indicate a sideways trend. The oversold area of the market, which will attract new buyers, is getting closer as the downtrend continues.

Technical indicators:
Key resistance levels – $1,800 and $2,000
Key support levels – $1,600 and $1,400
What’s next for Ethereum?
The largest altcoin is aiming to fall back to its previous lows. A sideways pattern can be seen in Ether’s decline. The overbought condition of the asset has halted altcoin’s upward movement. While retracing its steps to the previous low, Ether is likely to maintain its movement within the trading range.

As we reported on October 7, the largest altcoin hit a low of $1,607 before starting to rise again. The altcoin’s price fell to a range between $1,600 and $1,740, and when the range is broken, Ether will develop a trend.
Disclaimer. This analysis and forecast are the personal opinions of the author and are not a recommendation to buy or sell cryptocurrency and should not be viewed as an endorsement by CoinIdol.com. Readers should do their research before investing in funds.


