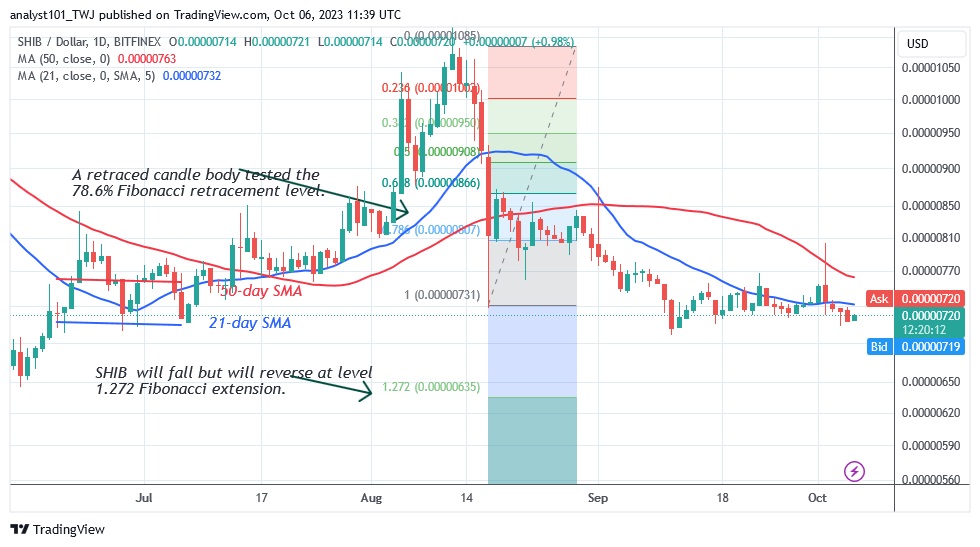
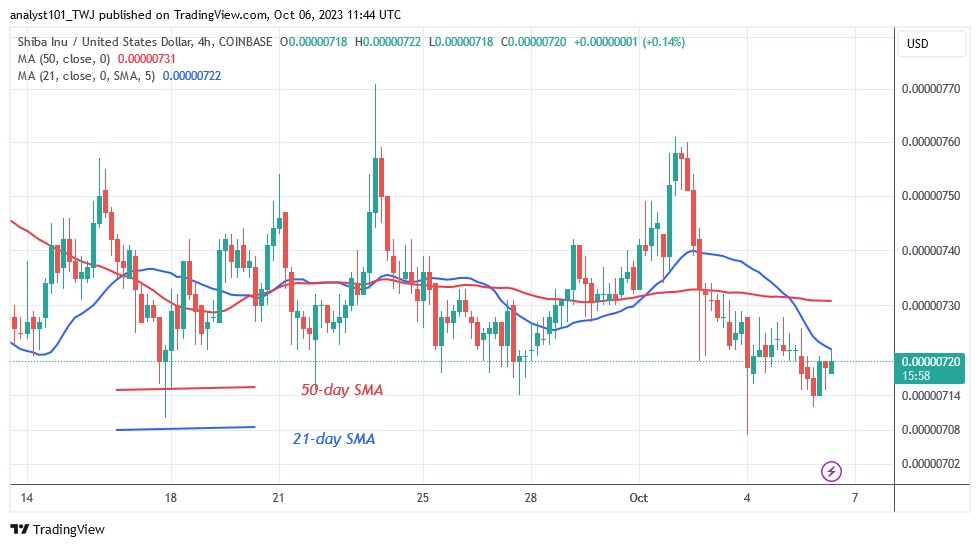
The latest price analysis by Coinidol.com report, the price of Shiba Inu (SHIB) has fallen even further since the rally on October 2.
Shiba Inu price long-term forecast: in range
The cryptocurrency asset rose to a high of $0.00000803 on October 2 before rapidly falling below the moving average lines. The altcoin hit a low of $0.00000713 today. The altcoin is being pushed lower by the bears to retest or break the previous September 11 low at $0.00000698. The cryptocurrency asset will fall to its low of $0.00000635 if the bears break the support level at $0.00000698 to the downside.
On the other hand, if the current support at $0.00000698 holds, the sideways trend will continue. This means that SHIB/USD will maintain its price range between $0.00000698 and $0.00000770. However, given the price signal, the altcoin is likely to fall.
Shiba Inu indicator analysis
The price bars for SHIB are below the moving average lines in two time frames. This indicates that the cryptocurrency will continue to move lower. The moving average lines have been horizontally flat since September 11, indicating a sideways trend.

Technical indicators
Key resistance levels: $0.00001200, $0.00001300, $0.00001400
Key support levels: $0.00000600, $0.00000550, $0.00000450
What is the next move for Shiba Inu?
After the rejection on October 2, SHIB/USD is gradually falling. The 21-day moving average line has stopped the rising movement. If the bears break below the support at $0.00000698, the slide will accelerate.

On September 30, 2023 cryptocurrency analytics specialists of Coinidol.com stated that the 21-day line SMA has slowed down the upward movement of the price. SHIB price is trying to break the 21-day line SMA today.
Disclaimer. This analysis and forecast are the personal opinions of the author and are not a recommendation to buy or sell cryptocurrency and should not be viewed as an endorsement by CoinIdol.com. Readers should do their research before investing in funds.


