Cryptocurrency price analysis brought by Coinidol.com. The BNB price is in choppy price action.
BNB price long term forecast: fluctuation range
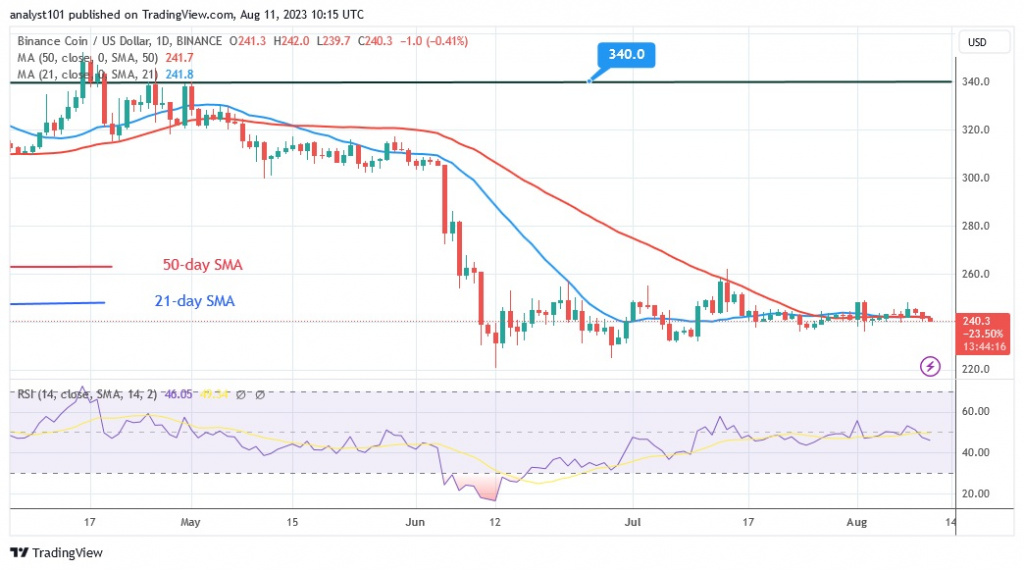
The doji candlesticks are currently consolidating above the current support level. At the time of writing, BNB is trading at $240.50. BNB’s price is currently flat horizontally. On a longer time scale, support and resistance levels have weakened. Bears have the upper hand as the cryptocurrency is trading in a bearish trend zone. BNB has the potential to fall to the current support level of $220. Meanwhile, the doji candlesticks have limited the price movement of the cryptocurrency.
BNB indicator display
In the 14th period, the price of the cryptocurrency has remained stable at the 46 level of the Relative Strength Index. The horizontal slope of the 21-day and 50-day simple moving averages indicating price consolidation is flat. BNB is currently trading below the daily stochastic level of 20. This explains why the altcoin is trading in the oversold zone of the market. Buyers are attracted to the oversold area, which leads to a rise in the cryptocurrency.

Technical indicators:
Key resistance levels – $300, $350, $400
Key support levels – $200, $150, $100
What is the next direction for BNB/USD?
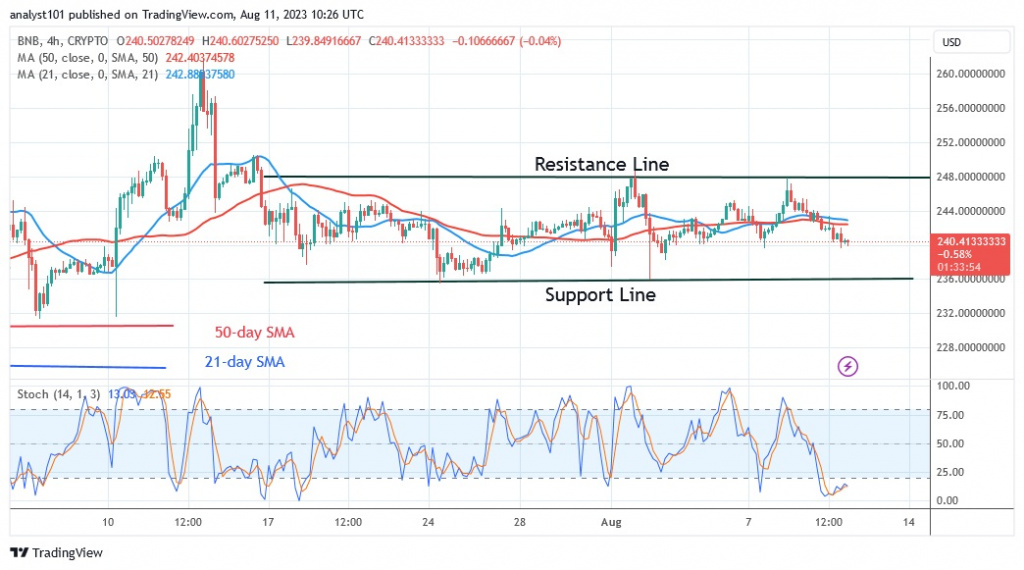
On the 4-hour chart, the BNB price is moving between $236 and $248. Doji candlesticks mark the movement within the range since July 16. The BNB price has not moved as buyers and sellers are unsure of the direction the market will take. The fluctuation ranges have not been broken in the past month.

As we reported on August 04, however, the price change was limited to the price range of $230 to $250. The price of BNB corrected upwards on August 1 and was rejected at the high of $247.
Disclaimer. This analysis and forecast are the personal opinions of the author and are not a recommendation to buy or sell cryptocurrency and should not be viewed as an endorsement by CoinIdol.com. Readers should do their research before investing in funds.


